Immigrants from Jordan vs Spanish American Indian 4 or more Vehicles in Household
COMPARE
Immigrants from Jordan
Spanish American Indian
4 or more Vehicles in Household
4 or more Vehicles in Household Comparison
Immigrants from Jordan
Spanish American Indians
6.5%
4 OR MORE VEHICLES IN HOUSEHOLD
73.7/ 100
METRIC RATING
148th/ 347
METRIC RANK
10.8%
4 OR MORE VEHICLES IN HOUSEHOLD
100.0/ 100
METRIC RATING
3rd/ 347
METRIC RANK
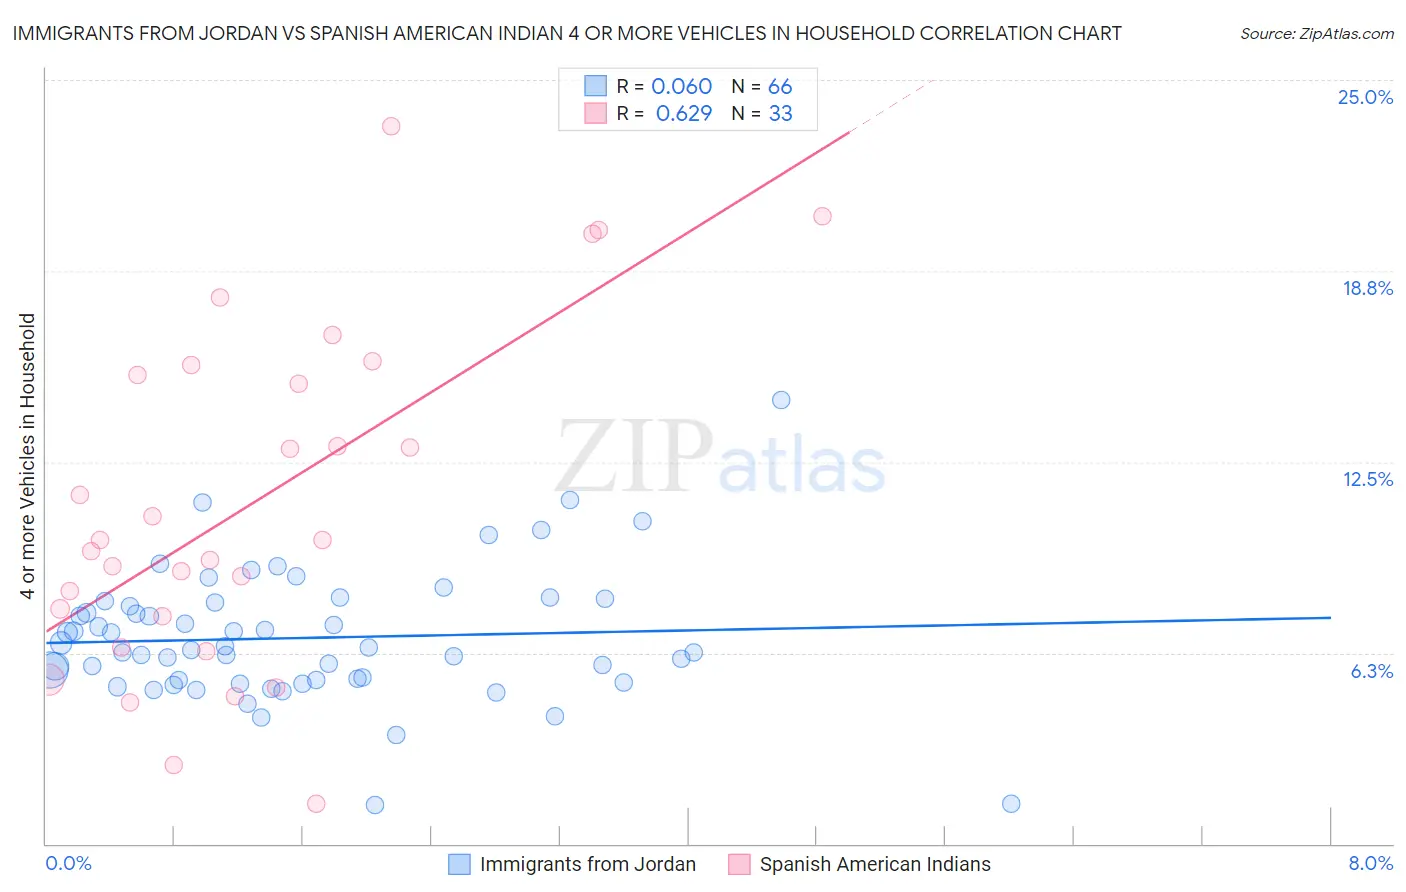
Immigrants from Jordan vs Spanish American Indian 4 or more Vehicles in Household Correlation Chart
The statistical analysis conducted on geographies consisting of 180,706,112 people shows a slight positive correlation between the proportion of Immigrants from Jordan and percentage of households with 4 or more vehicles available in the United States with a correlation coefficient (R) of 0.060 and weighted average of 6.5%. Similarly, the statistical analysis conducted on geographies consisting of 73,144,698 people shows a significant positive correlation between the proportion of Spanish American Indians and percentage of households with 4 or more vehicles available in the United States with a correlation coefficient (R) of 0.629 and weighted average of 10.8%, a difference of 65.9%.
4 or more Vehicles in Household Correlation Summary
| Measurement | Immigrants from Jordan | Spanish American Indian |
| Minimum | 1.3% | 1.3% |
| Maximum | 14.5% | 23.5% |
| Range | 13.3% | 22.2% |
| Mean | 6.7% | 11.1% |
| Median | 6.4% | 9.9% |
| Interquartile 25% (IQ1) | 5.3% | 6.9% |
| Interquartile 75% (IQ3) | 7.9% | 15.5% |
| Interquartile Range (IQR) | 2.6% | 8.6% |
| Standard Deviation (Sample) | 2.2% | 5.5% |
| Standard Deviation (Population) | 2.2% | 5.5% |
Similar Demographics by 4 or more Vehicles in Household
Demographics Similar to Immigrants from Jordan by 4 or more Vehicles in Household
In terms of 4 or more vehicles in household, the demographic groups most similar to Immigrants from Jordan are Greek (6.5%, a difference of 0.0%), Immigrants from Iran (6.5%, a difference of 0.040%), New Zealander (6.5%, a difference of 0.040%), Immigrants from Costa Rica (6.5%, a difference of 0.090%), and Immigrants from Hong Kong (6.5%, a difference of 0.18%).
| Demographics | Rating | Rank | 4 or more Vehicles in Household |
| Australians | 80.8 /100 | #141 | Excellent 6.6% |
| Immigrants | Iraq | 79.4 /100 | #142 | Good 6.5% |
| Immigrants | Canada | 78.6 /100 | #143 | Good 6.5% |
| Immigrants | North America | 78.5 /100 | #144 | Good 6.5% |
| Croatians | 77.8 /100 | #145 | Good 6.5% |
| Immigrants | Costa Rica | 74.4 /100 | #146 | Good 6.5% |
| Immigrants | Iran | 73.9 /100 | #147 | Good 6.5% |
| Immigrants | Jordan | 73.7 /100 | #148 | Good 6.5% |
| Greeks | 73.6 /100 | #149 | Good 6.5% |
| New Zealanders | 73.3 /100 | #150 | Good 6.5% |
| Immigrants | Hong Kong | 72.2 /100 | #151 | Good 6.5% |
| Yuman | 72.1 /100 | #152 | Good 6.5% |
| Immigrants | Armenia | 71.2 /100 | #153 | Good 6.5% |
| Central American Indians | 71.1 /100 | #154 | Good 6.5% |
| Iroquois | 70.4 /100 | #155 | Good 6.5% |
Demographics Similar to Spanish American Indians by 4 or more Vehicles in Household
In terms of 4 or more vehicles in household, the demographic groups most similar to Spanish American Indians are Colville (11.1%, a difference of 3.5%), Tongan (10.0%, a difference of 7.3%), Immigrants from Fiji (9.6%, a difference of 11.9%), Puget Sound Salish (9.4%, a difference of 14.7%), and Native Hawaiian (9.4%, a difference of 14.7%).
| Demographics | Rating | Rank | 4 or more Vehicles in Household |
| Yakama | 100 /100 | #1 | Exceptional 12.9% |
| Colville | 100.0 /100 | #2 | Exceptional 11.1% |
| Spanish American Indians | 100.0 /100 | #3 | Exceptional 10.8% |
| Tongans | 100.0 /100 | #4 | Exceptional 10.0% |
| Immigrants | Fiji | 100.0 /100 | #5 | Exceptional 9.6% |
| Puget Sound Salish | 100.0 /100 | #6 | Exceptional 9.4% |
| Native Hawaiians | 100.0 /100 | #7 | Exceptional 9.4% |
| Arapaho | 100.0 /100 | #8 | Exceptional 9.4% |
| Samoans | 100.0 /100 | #9 | Exceptional 9.2% |
| Paiute | 100.0 /100 | #10 | Exceptional 9.0% |
| Immigrants | Mexico | 100.0 /100 | #11 | Exceptional 9.0% |
| Mexicans | 100.0 /100 | #12 | Exceptional 8.9% |
| Hawaiians | 100.0 /100 | #13 | Exceptional 8.9% |
| Chinese | 100.0 /100 | #14 | Exceptional 8.8% |
| Shoshone | 100.0 /100 | #15 | Exceptional 8.8% |