Taiwanese vs Immigrants from Senegal Median Household Income
COMPARE
Taiwanese
Immigrants from Senegal
Median Household Income
Median Household Income Comparison
Taiwanese
Immigrants from Senegal
$89,900
MEDIAN HOUSEHOLD INCOME
95.6/ 100
METRIC RATING
117th/ 347
METRIC RANK
$76,915
MEDIAN HOUSEHOLD INCOME
0.5/ 100
METRIC RATING
257th/ 347
METRIC RANK
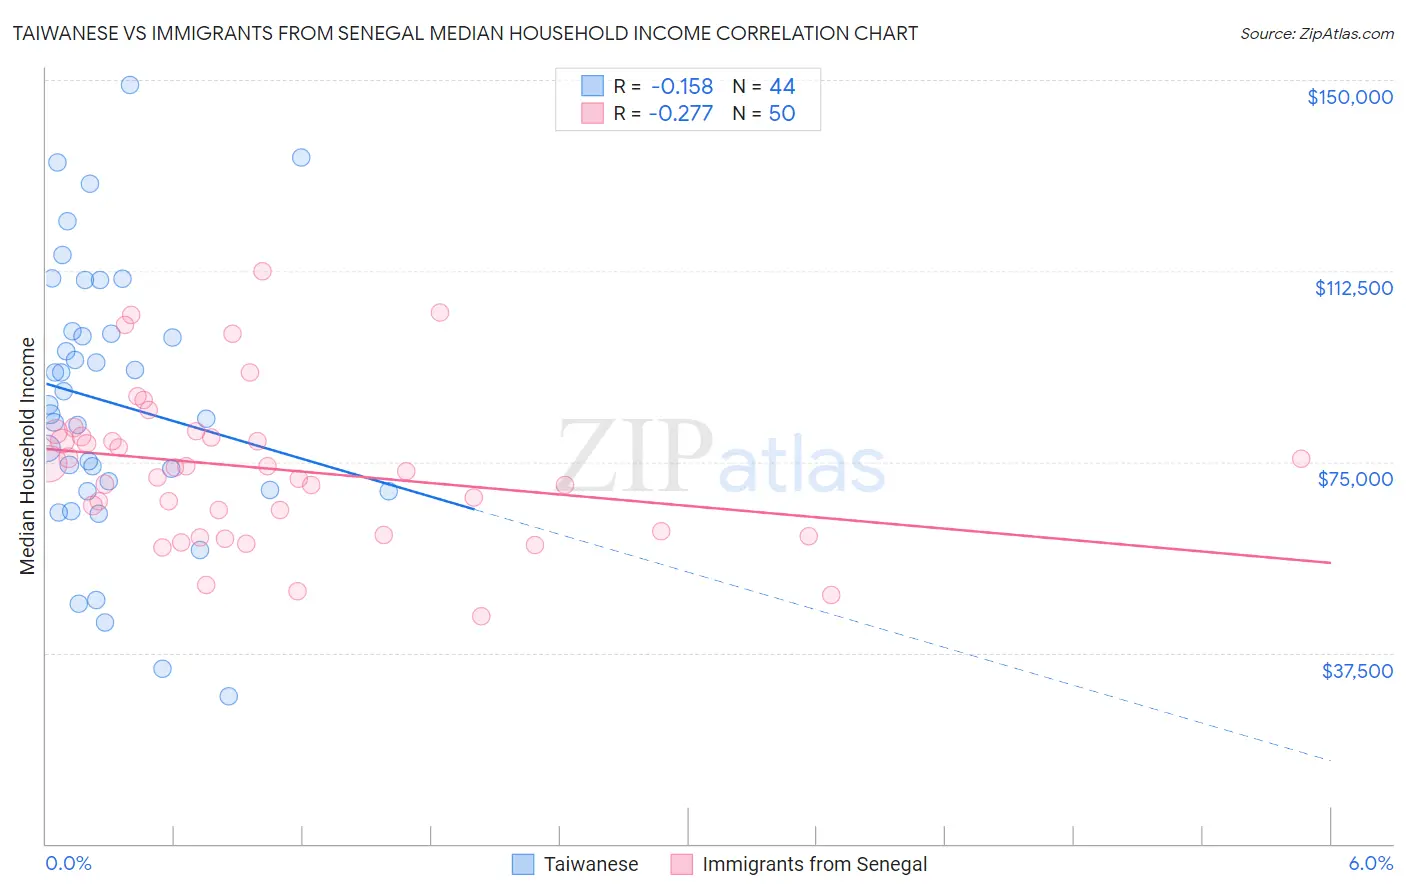
Taiwanese vs Immigrants from Senegal Median Household Income Correlation Chart
The statistical analysis conducted on geographies consisting of 31,709,765 people shows a poor negative correlation between the proportion of Taiwanese and median household income in the United States with a correlation coefficient (R) of -0.158 and weighted average of $89,900. Similarly, the statistical analysis conducted on geographies consisting of 90,107,777 people shows a weak negative correlation between the proportion of Immigrants from Senegal and median household income in the United States with a correlation coefficient (R) of -0.277 and weighted average of $76,915, a difference of 16.9%.
Median Household Income Correlation Summary
| Measurement | Taiwanese | Immigrants from Senegal |
| Minimum | $29,038 | $44,770 |
| Maximum | $149,028 | $112,479 |
| Range | $119,990 | $67,709 |
| Mean | $86,573 | $73,616 |
| Median | $85,327 | $73,578 |
| Interquartile 25% (IQ1) | $69,445 | $61,261 |
| Interquartile 75% (IQ3) | $100,383 | $80,057 |
| Interquartile Range (IQR) | $30,938 | $18,796 |
| Standard Deviation (Sample) | $26,800 | $14,821 |
| Standard Deviation (Population) | $26,494 | $14,672 |
Similar Demographics by Median Household Income
Demographics Similar to Taiwanese by Median Household Income
In terms of median household income, the demographic groups most similar to Taiwanese are Native Hawaiian ($89,919, a difference of 0.020%), Syrian ($89,830, a difference of 0.080%), Immigrants from Western Asia ($90,005, a difference of 0.12%), Immigrants from Northern Africa ($90,026, a difference of 0.14%), and Albanian ($89,744, a difference of 0.17%).
| Demographics | Rating | Rank | Median Household Income |
| Palestinians | 97.1 /100 | #110 | Exceptional $90,574 |
| Immigrants | Poland | 97.1 /100 | #111 | Exceptional $90,549 |
| Northern Europeans | 96.9 /100 | #112 | Exceptional $90,446 |
| Peruvians | 96.5 /100 | #113 | Exceptional $90,261 |
| Immigrants | Northern Africa | 95.9 /100 | #114 | Exceptional $90,026 |
| Immigrants | Western Asia | 95.9 /100 | #115 | Exceptional $90,005 |
| Native Hawaiians | 95.7 /100 | #116 | Exceptional $89,919 |
| Taiwanese | 95.6 /100 | #117 | Exceptional $89,900 |
| Syrians | 95.4 /100 | #118 | Exceptional $89,830 |
| Albanians | 95.2 /100 | #119 | Exceptional $89,744 |
| Immigrants | North Macedonia | 95.2 /100 | #120 | Exceptional $89,741 |
| Ethiopians | 94.9 /100 | #121 | Exceptional $89,640 |
| Pakistanis | 94.8 /100 | #122 | Exceptional $89,638 |
| Immigrants | Zimbabwe | 94.4 /100 | #123 | Exceptional $89,496 |
| Immigrants | Jordan | 94.1 /100 | #124 | Exceptional $89,412 |
Demographics Similar to Immigrants from Senegal by Median Household Income
In terms of median household income, the demographic groups most similar to Immigrants from Senegal are Belizean ($77,028, a difference of 0.15%), Immigrants from Nicaragua ($76,784, a difference of 0.17%), Spanish American Indian ($76,670, a difference of 0.32%), Jamaican ($76,583, a difference of 0.43%), and Immigrants from Grenada ($76,517, a difference of 0.52%).
| Demographics | Rating | Rank | Median Household Income |
| Immigrants | Laos | 1.3 /100 | #250 | Tragic $78,327 |
| Mexican American Indians | 1.2 /100 | #251 | Tragic $78,166 |
| Immigrants | West Indies | 1.0 /100 | #252 | Tragic $77,956 |
| Immigrants | St. Vincent and the Grenadines | 0.9 /100 | #253 | Tragic $77,690 |
| Sub-Saharan Africans | 0.8 /100 | #254 | Tragic $77,631 |
| Immigrants | Middle Africa | 0.8 /100 | #255 | Tragic $77,559 |
| Belizeans | 0.6 /100 | #256 | Tragic $77,028 |
| Immigrants | Senegal | 0.5 /100 | #257 | Tragic $76,915 |
| Immigrants | Nicaragua | 0.5 /100 | #258 | Tragic $76,784 |
| Spanish American Indians | 0.4 /100 | #259 | Tragic $76,670 |
| Jamaicans | 0.4 /100 | #260 | Tragic $76,583 |
| Immigrants | Grenada | 0.4 /100 | #261 | Tragic $76,517 |
| French American Indians | 0.4 /100 | #262 | Tragic $76,387 |
| Alaskan Athabascans | 0.4 /100 | #263 | Tragic $76,383 |
| Guatemalans | 0.3 /100 | #264 | Tragic $75,961 |