Immigrants from Thailand vs Immigrants from Senegal 4 or more Vehicles in Household
COMPARE
Immigrants from Thailand
Immigrants from Senegal
4 or more Vehicles in Household
4 or more Vehicles in Household Comparison
Immigrants from Thailand
Immigrants from Senegal
6.9%
4 OR MORE VEHICLES IN HOUSEHOLD
97.0/ 100
METRIC RATING
110th/ 347
METRIC RANK
4.2%
4 OR MORE VEHICLES IN HOUSEHOLD
0.0/ 100
METRIC RATING
329th/ 347
METRIC RANK
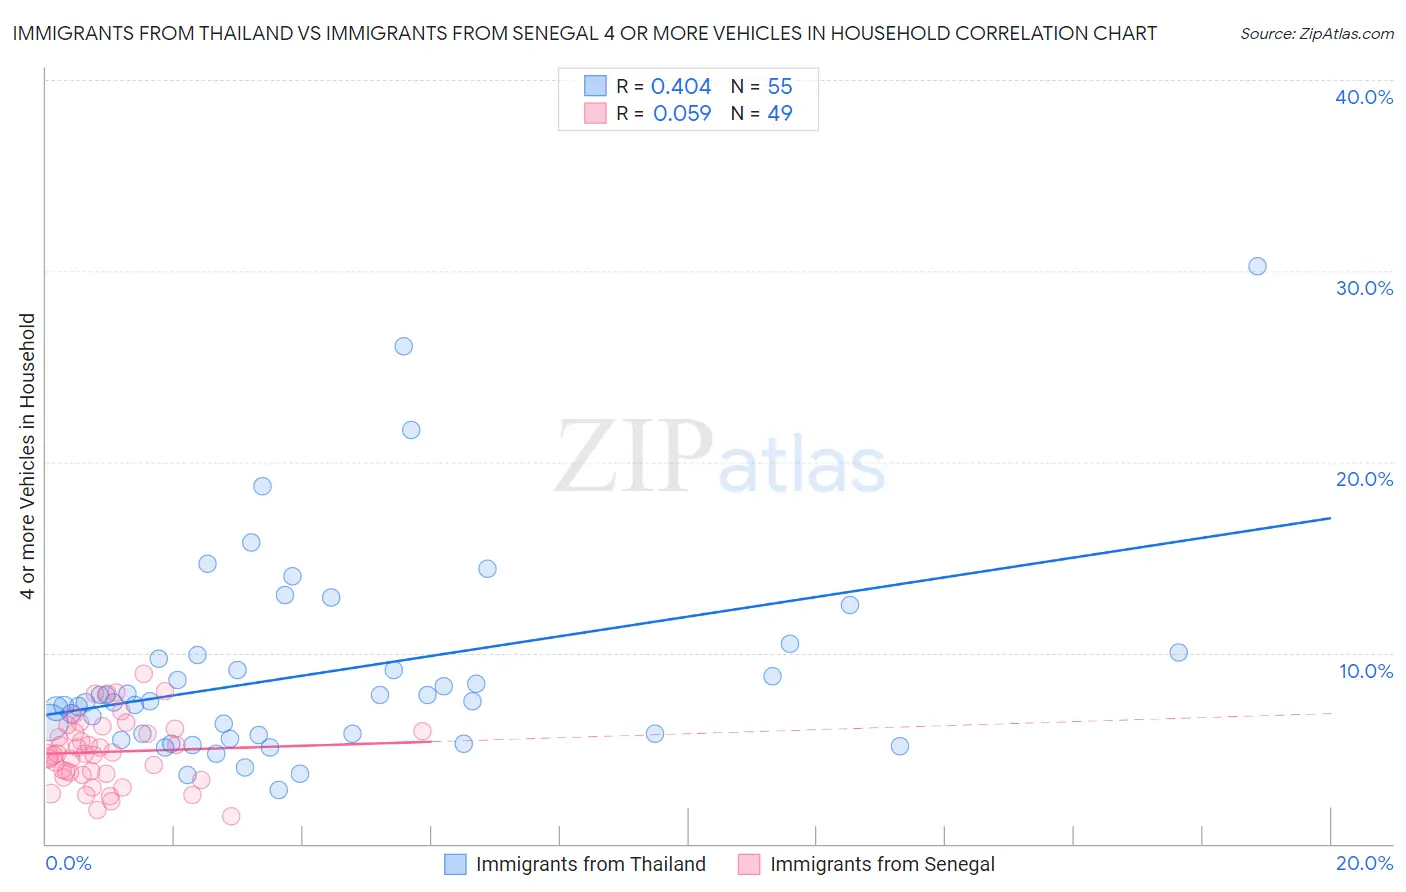
Immigrants from Thailand vs Immigrants from Senegal 4 or more Vehicles in Household Correlation Chart
The statistical analysis conducted on geographies consisting of 315,917,878 people shows a moderate positive correlation between the proportion of Immigrants from Thailand and percentage of households with 4 or more vehicles available in the United States with a correlation coefficient (R) of 0.404 and weighted average of 6.9%. Similarly, the statistical analysis conducted on geographies consisting of 89,828,164 people shows a slight positive correlation between the proportion of Immigrants from Senegal and percentage of households with 4 or more vehicles available in the United States with a correlation coefficient (R) of 0.059 and weighted average of 4.2%, a difference of 62.2%.
4 or more Vehicles in Household Correlation Summary
| Measurement | Immigrants from Thailand | Immigrants from Senegal |
| Minimum | 2.8% | 1.5% |
| Maximum | 30.2% | 8.9% |
| Range | 27.4% | 7.5% |
| Mean | 9.0% | 4.8% |
| Median | 7.5% | 4.7% |
| Interquartile 25% (IQ1) | 5.7% | 3.6% |
| Interquartile 75% (IQ3) | 9.9% | 6.0% |
| Interquartile Range (IQR) | 4.2% | 2.3% |
| Standard Deviation (Sample) | 5.3% | 1.7% |
| Standard Deviation (Population) | 5.3% | 1.7% |
Similar Demographics by 4 or more Vehicles in Household
Demographics Similar to Immigrants from Thailand by 4 or more Vehicles in Household
In terms of 4 or more vehicles in household, the demographic groups most similar to Immigrants from Thailand are Aleut (6.9%, a difference of 0.020%), Hopi (6.9%, a difference of 0.030%), Canadian (6.9%, a difference of 0.45%), Filipino (6.9%, a difference of 0.50%), and Bolivian (6.8%, a difference of 0.50%).
| Demographics | Rating | Rank | 4 or more Vehicles in Household |
| Blackfeet | 98.6 /100 | #103 | Exceptional 7.0% |
| Hmong | 98.3 /100 | #104 | Exceptional 7.0% |
| German Russians | 98.3 /100 | #105 | Exceptional 7.0% |
| Guatemalans | 98.1 /100 | #106 | Exceptional 7.0% |
| Nicaraguans | 98.0 /100 | #107 | Exceptional 7.0% |
| French | 97.7 /100 | #108 | Exceptional 6.9% |
| Filipinos | 97.6 /100 | #109 | Exceptional 6.9% |
| Immigrants | Thailand | 97.0 /100 | #110 | Exceptional 6.9% |
| Aleuts | 97.0 /100 | #111 | Exceptional 6.9% |
| Hopi | 97.0 /100 | #112 | Exceptional 6.9% |
| Canadians | 96.4 /100 | #113 | Exceptional 6.9% |
| Bolivians | 96.3 /100 | #114 | Exceptional 6.8% |
| Tlingit-Haida | 96.2 /100 | #115 | Exceptional 6.8% |
| Immigrants | Guatemala | 95.8 /100 | #116 | Exceptional 6.8% |
| Burmese | 95.7 /100 | #117 | Exceptional 6.8% |
Demographics Similar to Immigrants from Senegal by 4 or more Vehicles in Household
In terms of 4 or more vehicles in household, the demographic groups most similar to Immigrants from Senegal are Immigrants from Ecuador (4.2%, a difference of 0.20%), Trinidadian and Tobagonian (4.3%, a difference of 0.27%), West Indian (4.2%, a difference of 0.46%), Immigrants from Dominica (4.2%, a difference of 1.4%), and Senegalese (4.3%, a difference of 1.9%).
| Demographics | Rating | Rank | 4 or more Vehicles in Household |
| Immigrants | Yemen | 0.0 /100 | #322 | Tragic 4.5% |
| Immigrants | Caribbean | 0.0 /100 | #323 | Tragic 4.4% |
| Soviet Union | 0.0 /100 | #324 | Tragic 4.4% |
| Immigrants | Jamaica | 0.0 /100 | #325 | Tragic 4.4% |
| Cape Verdeans | 0.0 /100 | #326 | Tragic 4.4% |
| Senegalese | 0.0 /100 | #327 | Tragic 4.3% |
| Trinidadians and Tobagonians | 0.0 /100 | #328 | Tragic 4.3% |
| Immigrants | Senegal | 0.0 /100 | #329 | Tragic 4.2% |
| Immigrants | Ecuador | 0.0 /100 | #330 | Tragic 4.2% |
| West Indians | 0.0 /100 | #331 | Tragic 4.2% |
| Immigrants | Dominica | 0.0 /100 | #332 | Tragic 4.2% |
| Immigrants | Albania | 0.0 /100 | #333 | Tragic 4.1% |
| Immigrants | Trinidad and Tobago | 0.0 /100 | #334 | Tragic 4.1% |
| Barbadians | 0.0 /100 | #335 | Tragic 3.9% |
| Immigrants | Bangladesh | 0.0 /100 | #336 | Tragic 3.9% |