Syrian vs Immigrants from Senegal 4 or more Vehicles in Household
COMPARE
Syrian
Immigrants from Senegal
4 or more Vehicles in Household
4 or more Vehicles in Household Comparison
Syrians
Immigrants from Senegal
6.3%
4 OR MORE VEHICLES IN HOUSEHOLD
42.0/ 100
METRIC RATING
180th/ 347
METRIC RANK
4.2%
4 OR MORE VEHICLES IN HOUSEHOLD
0.0/ 100
METRIC RATING
329th/ 347
METRIC RANK
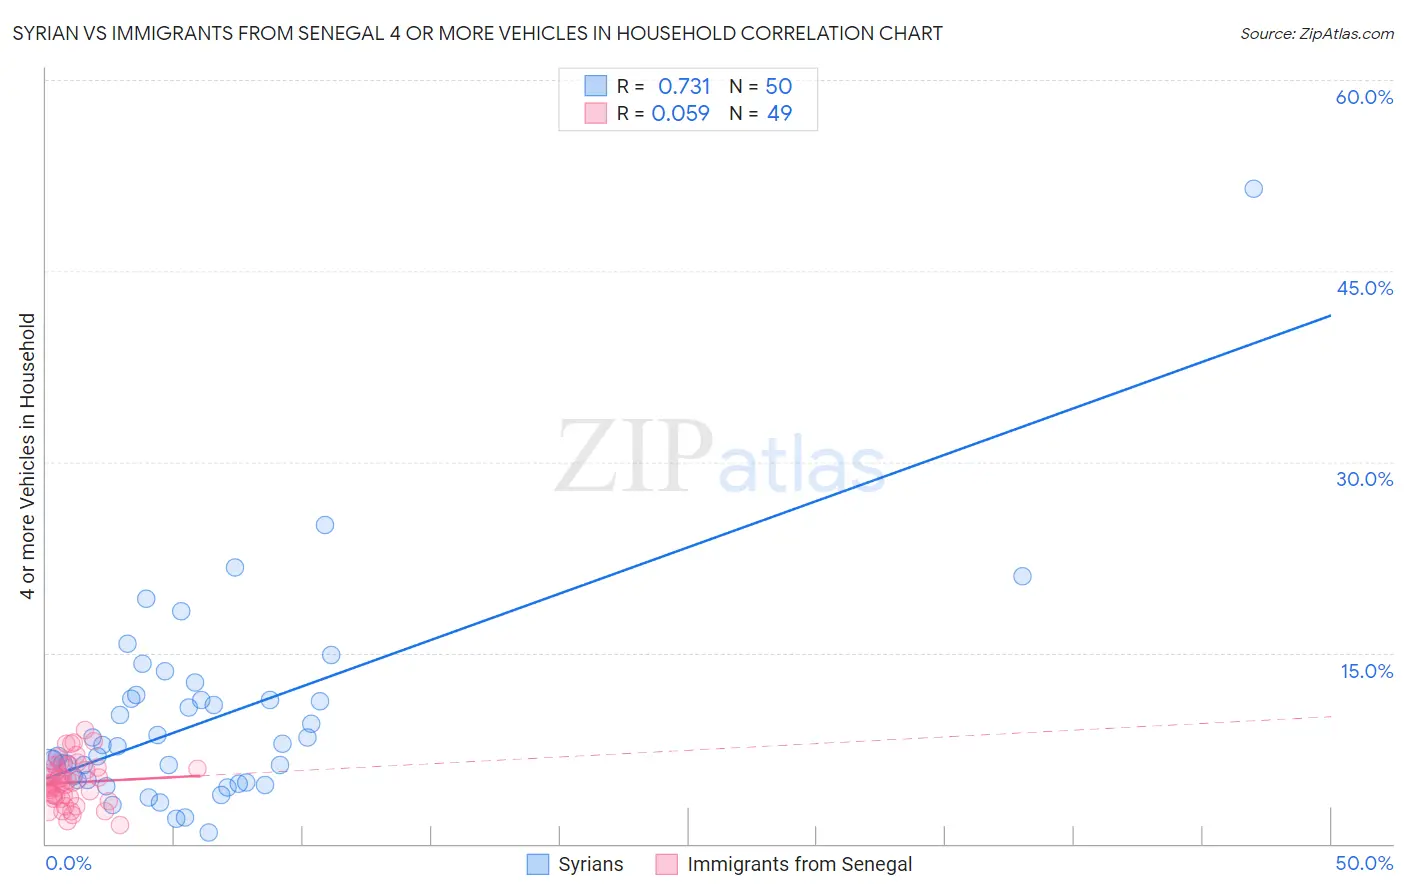
Syrian vs Immigrants from Senegal 4 or more Vehicles in Household Correlation Chart
The statistical analysis conducted on geographies consisting of 265,313,464 people shows a strong positive correlation between the proportion of Syrians and percentage of households with 4 or more vehicles available in the United States with a correlation coefficient (R) of 0.731 and weighted average of 6.3%. Similarly, the statistical analysis conducted on geographies consisting of 89,828,164 people shows a slight positive correlation between the proportion of Immigrants from Senegal and percentage of households with 4 or more vehicles available in the United States with a correlation coefficient (R) of 0.059 and weighted average of 4.2%, a difference of 47.9%.
4 or more Vehicles in Household Correlation Summary
| Measurement | Syrian | Immigrants from Senegal |
| Minimum | 0.87% | 1.5% |
| Maximum | 51.4% | 8.9% |
| Range | 50.6% | 7.5% |
| Mean | 9.8% | 4.8% |
| Median | 7.7% | 4.7% |
| Interquartile 25% (IQ1) | 5.0% | 3.6% |
| Interquartile 75% (IQ3) | 11.4% | 6.0% |
| Interquartile Range (IQR) | 6.4% | 2.3% |
| Standard Deviation (Sample) | 8.1% | 1.7% |
| Standard Deviation (Population) | 8.0% | 1.7% |
Similar Demographics by 4 or more Vehicles in Household
Demographics Similar to Syrians by 4 or more Vehicles in Household
In terms of 4 or more vehicles in household, the demographic groups most similar to Syrians are Yugoslavian (6.3%, a difference of 0.090%), Immigrants from Japan (6.3%, a difference of 0.11%), South American Indian (6.3%, a difference of 0.14%), Belizean (6.3%, a difference of 0.27%), and Immigrants from Burma/Myanmar (6.2%, a difference of 0.48%).
| Demographics | Rating | Rank | 4 or more Vehicles in Household |
| Slovenes | 51.1 /100 | #173 | Average 6.3% |
| Lithuanians | 50.0 /100 | #174 | Average 6.3% |
| Immigrants | Western Europe | 48.8 /100 | #175 | Average 6.3% |
| Ukrainians | 47.6 /100 | #176 | Average 6.3% |
| Slovaks | 46.9 /100 | #177 | Average 6.3% |
| Belizeans | 44.5 /100 | #178 | Average 6.3% |
| Immigrants | Japan | 43.1 /100 | #179 | Average 6.3% |
| Syrians | 42.0 /100 | #180 | Average 6.3% |
| Yugoslavians | 41.1 /100 | #181 | Average 6.3% |
| South American Indians | 40.7 /100 | #182 | Average 6.3% |
| Immigrants | Burma/Myanmar | 37.5 /100 | #183 | Fair 6.2% |
| Iraqis | 37.3 /100 | #184 | Fair 6.2% |
| Thais | 36.9 /100 | #185 | Fair 6.2% |
| Immigrants | Northern Europe | 36.8 /100 | #186 | Fair 6.2% |
| Immigrants | South Africa | 35.4 /100 | #187 | Fair 6.2% |
Demographics Similar to Immigrants from Senegal by 4 or more Vehicles in Household
In terms of 4 or more vehicles in household, the demographic groups most similar to Immigrants from Senegal are Immigrants from Ecuador (4.2%, a difference of 0.20%), Trinidadian and Tobagonian (4.3%, a difference of 0.27%), West Indian (4.2%, a difference of 0.46%), Immigrants from Dominica (4.2%, a difference of 1.4%), and Senegalese (4.3%, a difference of 1.9%).
| Demographics | Rating | Rank | 4 or more Vehicles in Household |
| Immigrants | Yemen | 0.0 /100 | #322 | Tragic 4.5% |
| Immigrants | Caribbean | 0.0 /100 | #323 | Tragic 4.4% |
| Soviet Union | 0.0 /100 | #324 | Tragic 4.4% |
| Immigrants | Jamaica | 0.0 /100 | #325 | Tragic 4.4% |
| Cape Verdeans | 0.0 /100 | #326 | Tragic 4.4% |
| Senegalese | 0.0 /100 | #327 | Tragic 4.3% |
| Trinidadians and Tobagonians | 0.0 /100 | #328 | Tragic 4.3% |
| Immigrants | Senegal | 0.0 /100 | #329 | Tragic 4.2% |
| Immigrants | Ecuador | 0.0 /100 | #330 | Tragic 4.2% |
| West Indians | 0.0 /100 | #331 | Tragic 4.2% |
| Immigrants | Dominica | 0.0 /100 | #332 | Tragic 4.2% |
| Immigrants | Albania | 0.0 /100 | #333 | Tragic 4.1% |
| Immigrants | Trinidad and Tobago | 0.0 /100 | #334 | Tragic 4.1% |
| Barbadians | 0.0 /100 | #335 | Tragic 3.9% |
| Immigrants | Bangladesh | 0.0 /100 | #336 | Tragic 3.9% |