Taiwanese vs Immigrants from Senegal Female Unemployment
COMPARE
Taiwanese
Immigrants from Senegal
Female Unemployment
Female Unemployment Comparison
Taiwanese
Immigrants from Senegal
5.3%
FEMALE UNEMPLOYMENT
42.7/ 100
METRIC RATING
181st/ 347
METRIC RANK
6.1%
FEMALE UNEMPLOYMENT
0.0/ 100
METRIC RATING
284th/ 347
METRIC RANK
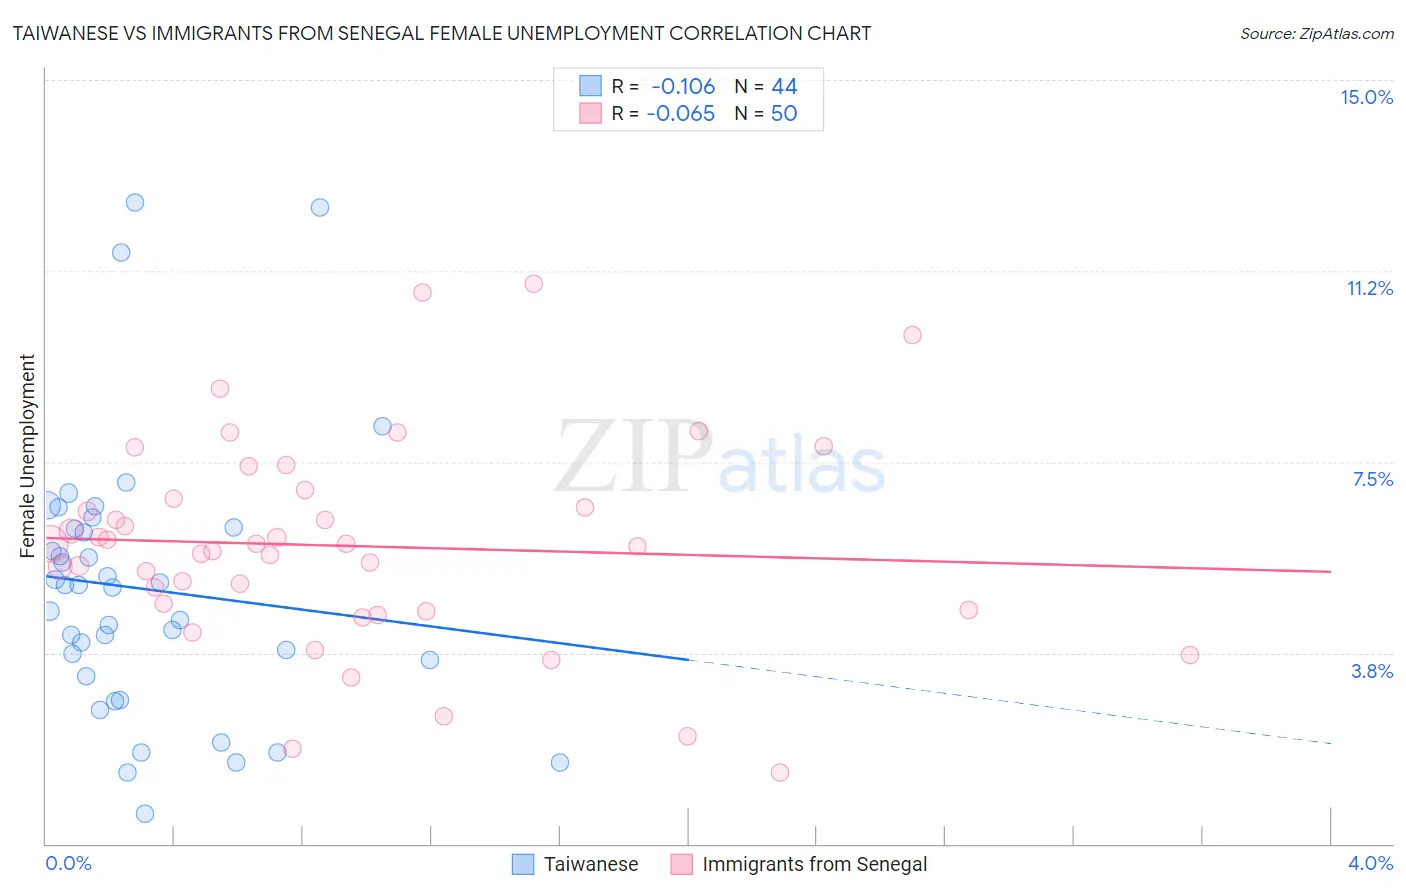
Taiwanese vs Immigrants from Senegal Female Unemployment Correlation Chart
The statistical analysis conducted on geographies consisting of 31,724,268 people shows a poor negative correlation between the proportion of Taiwanese and unemploymnet rate among females in the United States with a correlation coefficient (R) of -0.106 and weighted average of 5.3%. Similarly, the statistical analysis conducted on geographies consisting of 90,121,254 people shows a slight negative correlation between the proportion of Immigrants from Senegal and unemploymnet rate among females in the United States with a correlation coefficient (R) of -0.065 and weighted average of 6.1%, a difference of 14.7%.
Female Unemployment Correlation Summary
| Measurement | Taiwanese | Immigrants from Senegal |
| Minimum | 0.60% | 1.4% |
| Maximum | 12.6% | 11.0% |
| Range | 12.0% | 9.6% |
| Mean | 5.0% | 5.8% |
| Median | 5.0% | 5.9% |
| Interquartile 25% (IQ1) | 3.4% | 4.6% |
| Interquartile 75% (IQ3) | 6.2% | 6.8% |
| Interquartile Range (IQR) | 2.8% | 2.2% |
| Standard Deviation (Sample) | 2.7% | 2.0% |
| Standard Deviation (Population) | 2.6% | 2.0% |
Similar Demographics by Female Unemployment
Demographics Similar to Taiwanese by Female Unemployment
In terms of female unemployment, the demographic groups most similar to Taiwanese are Nonimmigrants (5.3%, a difference of 0.010%), Immigrants from Congo (5.3%, a difference of 0.020%), Immigrants from Indonesia (5.3%, a difference of 0.12%), Laotian (5.3%, a difference of 0.14%), and Immigrants from Ukraine (5.3%, a difference of 0.16%).
| Demographics | Rating | Rank | Female Unemployment |
| Immigrants | Poland | 50.0 /100 | #174 | Average 5.3% |
| Immigrants | Laos | 47.5 /100 | #175 | Average 5.3% |
| Immigrants | Vietnam | 47.5 /100 | #176 | Average 5.3% |
| Immigrants | Morocco | 47.4 /100 | #177 | Average 5.3% |
| Immigrants | Southern Europe | 46.2 /100 | #178 | Average 5.3% |
| Laotians | 45.1 /100 | #179 | Average 5.3% |
| Immigrants | Congo | 43.1 /100 | #180 | Average 5.3% |
| Taiwanese | 42.7 /100 | #181 | Average 5.3% |
| Immigrants | Nonimmigrants | 42.6 /100 | #182 | Average 5.3% |
| Immigrants | Indonesia | 40.7 /100 | #183 | Average 5.3% |
| Immigrants | Ukraine | 40.1 /100 | #184 | Average 5.3% |
| Malaysians | 40.1 /100 | #185 | Average 5.3% |
| Immigrants | Belarus | 39.4 /100 | #186 | Fair 5.3% |
| Immigrants | Albania | 35.4 /100 | #187 | Fair 5.3% |
| Afghans | 33.9 /100 | #188 | Fair 5.3% |
Demographics Similar to Immigrants from Senegal by Female Unemployment
In terms of female unemployment, the demographic groups most similar to Immigrants from Senegal are Salvadoran (6.0%, a difference of 0.34%), Immigrants from Cabo Verde (6.1%, a difference of 0.38%), Chippewa (6.1%, a difference of 0.40%), Immigrants from Guatemala (6.1%, a difference of 0.43%), and Colville (6.0%, a difference of 0.44%).
| Demographics | Rating | Rank | Female Unemployment |
| Immigrants | Ghana | 0.0 /100 | #277 | Tragic 6.0% |
| Yaqui | 0.0 /100 | #278 | Tragic 6.0% |
| Armenians | 0.0 /100 | #279 | Tragic 6.0% |
| Mexican American Indians | 0.0 /100 | #280 | Tragic 6.0% |
| Guatemalans | 0.0 /100 | #281 | Tragic 6.0% |
| Colville | 0.0 /100 | #282 | Tragic 6.0% |
| Salvadorans | 0.0 /100 | #283 | Tragic 6.0% |
| Immigrants | Senegal | 0.0 /100 | #284 | Tragic 6.1% |
| Immigrants | Cabo Verde | 0.0 /100 | #285 | Tragic 6.1% |
| Chippewa | 0.0 /100 | #286 | Tragic 6.1% |
| Immigrants | Guatemala | 0.0 /100 | #287 | Tragic 6.1% |
| Haitians | 0.0 /100 | #288 | Tragic 6.1% |
| Trinidadians and Tobagonians | 0.0 /100 | #289 | Tragic 6.1% |
| Immigrants | Caribbean | 0.0 /100 | #290 | Tragic 6.1% |
| Immigrants | West Indies | 0.0 /100 | #291 | Tragic 6.1% |