Swedish vs Immigrants from Greece In Labor Force | Age 35-44
COMPARE
Swedish
Immigrants from Greece
In Labor Force | Age 35-44
In Labor Force | Age 35-44 Comparison
Swedes
Immigrants from Greece
85.0%
IN LABOR FORCE | AGE 35-44
99.2/ 100
METRIC RATING
64th/ 347
METRIC RANK
85.3%
IN LABOR FORCE | AGE 35-44
99.9/ 100
METRIC RATING
28th/ 347
METRIC RANK
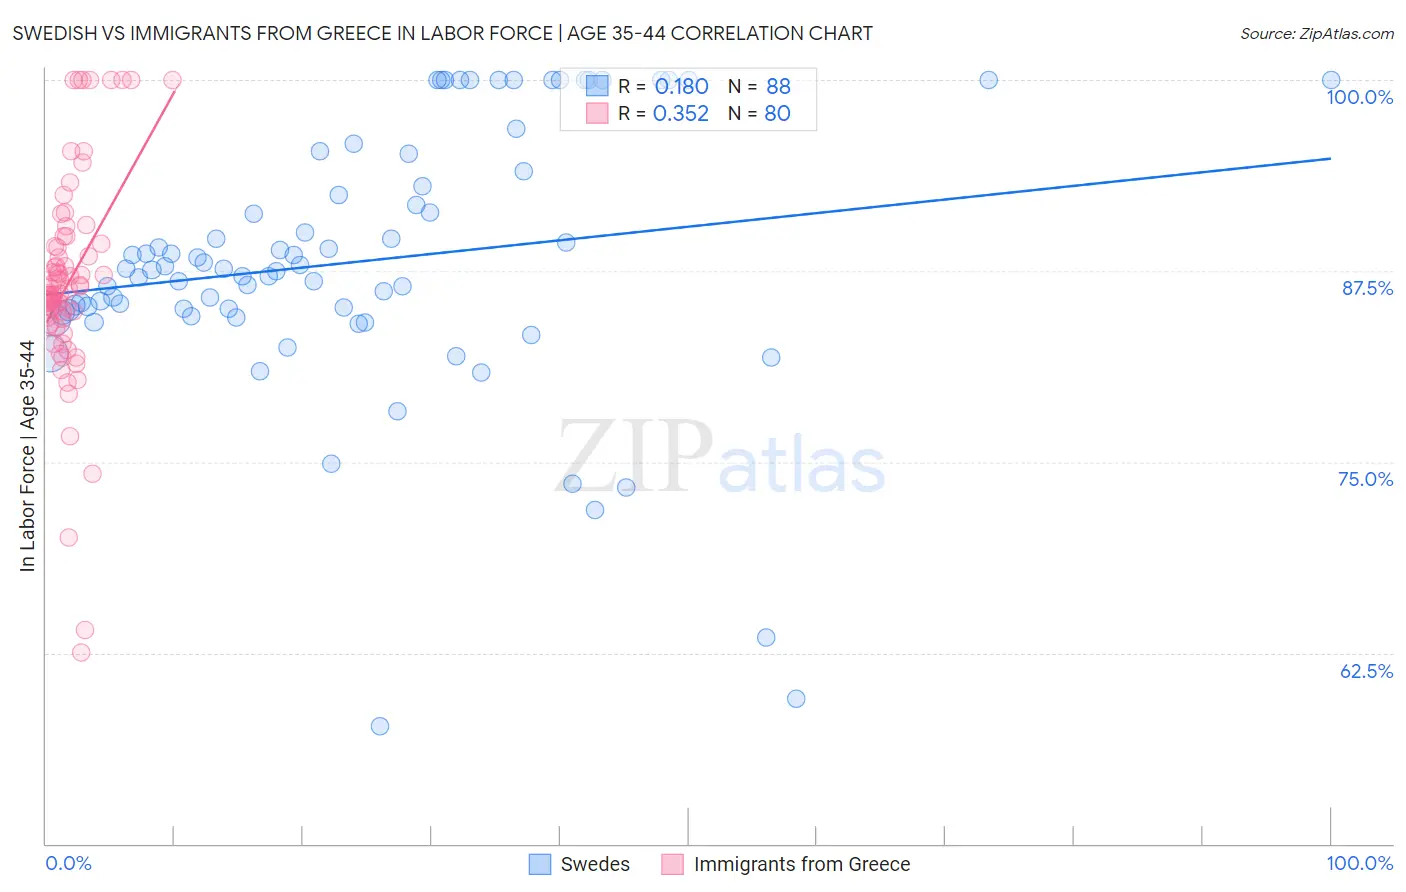
Swedish vs Immigrants from Greece In Labor Force | Age 35-44 Correlation Chart
The statistical analysis conducted on geographies consisting of 538,724,566 people shows a poor positive correlation between the proportion of Swedes and labor force participation rate among population between the ages 35 and 44 in the United States with a correlation coefficient (R) of 0.180 and weighted average of 85.0%. Similarly, the statistical analysis conducted on geographies consisting of 216,859,969 people shows a mild positive correlation between the proportion of Immigrants from Greece and labor force participation rate among population between the ages 35 and 44 in the United States with a correlation coefficient (R) of 0.352 and weighted average of 85.3%, a difference of 0.37%.
In Labor Force | Age 35-44 Correlation Summary
| Measurement | Swedish | Immigrants from Greece |
| Minimum | 57.7% | 62.5% |
| Maximum | 100.0% | 100.0% |
| Range | 42.3% | 37.5% |
| Mean | 88.1% | 86.7% |
| Median | 87.6% | 86.2% |
| Interquartile 25% (IQ1) | 84.9% | 84.2% |
| Interquartile 75% (IQ3) | 93.5% | 89.2% |
| Interquartile Range (IQR) | 8.6% | 4.9% |
| Standard Deviation (Sample) | 8.7% | 7.0% |
| Standard Deviation (Population) | 8.6% | 6.9% |
Similar Demographics by In Labor Force | Age 35-44
Demographics Similar to Swedes by In Labor Force | Age 35-44
In terms of in labor force | age 35-44, the demographic groups most similar to Swedes are Immigrants from Moldova (85.0%, a difference of 0.010%), Immigrants from Uganda (85.0%, a difference of 0.010%), Immigrants from Brazil (85.0%, a difference of 0.010%), Immigrants from Latvia (85.0%, a difference of 0.020%), and Immigrants from Haiti (85.0%, a difference of 0.020%).
| Demographics | Rating | Rank | In Labor Force | Age 35-44 |
| Chinese | 99.4 /100 | #57 | Exceptional 85.1% |
| Slovaks | 99.4 /100 | #58 | Exceptional 85.1% |
| Serbians | 99.4 /100 | #59 | Exceptional 85.1% |
| Albanians | 99.4 /100 | #60 | Exceptional 85.1% |
| Immigrants | Latvia | 99.3 /100 | #61 | Exceptional 85.0% |
| Immigrants | Moldova | 99.3 /100 | #62 | Exceptional 85.0% |
| Immigrants | Uganda | 99.3 /100 | #63 | Exceptional 85.0% |
| Swedes | 99.2 /100 | #64 | Exceptional 85.0% |
| Immigrants | Brazil | 99.2 /100 | #65 | Exceptional 85.0% |
| Immigrants | Haiti | 99.1 /100 | #66 | Exceptional 85.0% |
| Immigrants | Italy | 99.1 /100 | #67 | Exceptional 85.0% |
| Italians | 99.1 /100 | #68 | Exceptional 85.0% |
| Sudanese | 99.0 /100 | #69 | Exceptional 85.0% |
| Brazilians | 99.0 /100 | #70 | Exceptional 85.0% |
| Russians | 99.0 /100 | #71 | Exceptional 85.0% |
Demographics Similar to Immigrants from Greece by In Labor Force | Age 35-44
In terms of in labor force | age 35-44, the demographic groups most similar to Immigrants from Greece are Immigrants from Lithuania (85.4%, a difference of 0.010%), Paraguayan (85.4%, a difference of 0.020%), Immigrants from Liberia (85.4%, a difference of 0.020%), Latvian (85.4%, a difference of 0.030%), and Cambodian (85.3%, a difference of 0.040%).
| Demographics | Rating | Rank | In Labor Force | Age 35-44 |
| Bulgarians | 100.0 /100 | #21 | Exceptional 85.5% |
| Immigrants | Bosnia and Herzegovina | 100.0 /100 | #22 | Exceptional 85.4% |
| Immigrants | Eastern Africa | 100.0 /100 | #23 | Exceptional 85.4% |
| Latvians | 99.9 /100 | #24 | Exceptional 85.4% |
| Paraguayans | 99.9 /100 | #25 | Exceptional 85.4% |
| Immigrants | Liberia | 99.9 /100 | #26 | Exceptional 85.4% |
| Immigrants | Lithuania | 99.9 /100 | #27 | Exceptional 85.4% |
| Immigrants | Greece | 99.9 /100 | #28 | Exceptional 85.3% |
| Cambodians | 99.9 /100 | #29 | Exceptional 85.3% |
| Bermudans | 99.9 /100 | #30 | Exceptional 85.3% |
| Czechs | 99.9 /100 | #31 | Exceptional 85.3% |
| Immigrants | India | 99.9 /100 | #32 | Exceptional 85.3% |
| Ugandans | 99.9 /100 | #33 | Exceptional 85.3% |
| Immigrants | Nepal | 99.9 /100 | #34 | Exceptional 85.3% |
| Estonians | 99.9 /100 | #35 | Exceptional 85.3% |