Sudanese vs Hungarian 4 or more Vehicles in Household
COMPARE
Sudanese
Hungarian
4 or more Vehicles in Household
4 or more Vehicles in Household Comparison
Sudanese
Hungarians
5.6%
4 OR MORE VEHICLES IN HOUSEHOLD
1.2/ 100
METRIC RATING
261st/ 347
METRIC RANK
6.4%
4 OR MORE VEHICLES IN HOUSEHOLD
61.1/ 100
METRIC RATING
164th/ 347
METRIC RANK
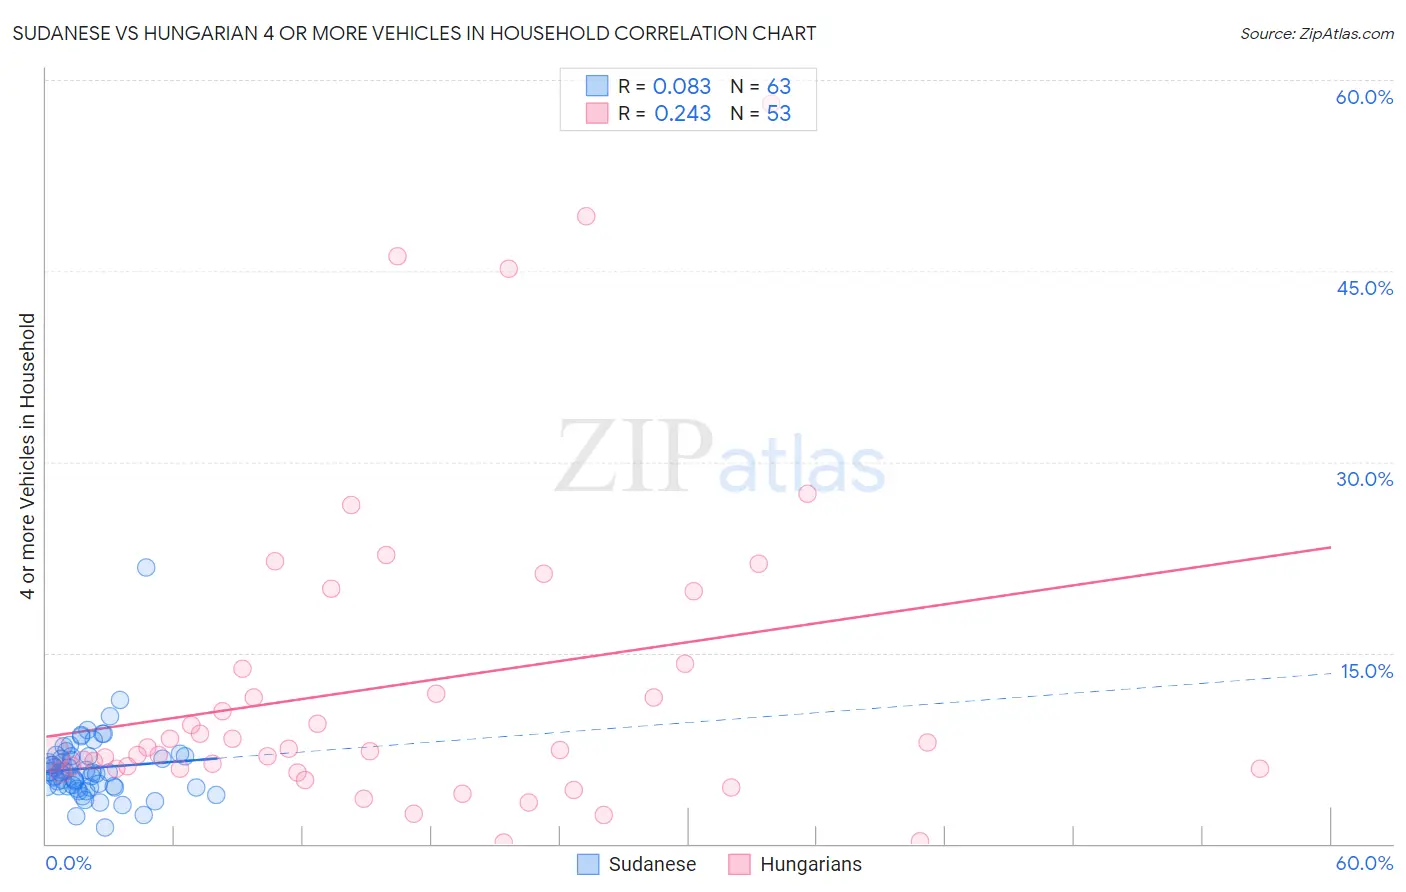
Sudanese vs Hungarian 4 or more Vehicles in Household Correlation Chart
The statistical analysis conducted on geographies consisting of 109,909,032 people shows a slight positive correlation between the proportion of Sudanese and percentage of households with 4 or more vehicles available in the United States with a correlation coefficient (R) of 0.083 and weighted average of 5.6%. Similarly, the statistical analysis conducted on geographies consisting of 483,846,610 people shows a weak positive correlation between the proportion of Hungarians and percentage of households with 4 or more vehicles available in the United States with a correlation coefficient (R) of 0.243 and weighted average of 6.4%, a difference of 13.8%.
4 or more Vehicles in Household Correlation Summary
| Measurement | Sudanese | Hungarian |
| Minimum | 1.3% | 0.062% |
| Maximum | 21.7% | 58.1% |
| Range | 20.5% | 58.1% |
| Mean | 5.9% | 12.4% |
| Median | 5.6% | 7.3% |
| Interquartile 25% (IQ1) | 4.5% | 5.9% |
| Interquartile 75% (IQ3) | 6.9% | 13.9% |
| Interquartile Range (IQR) | 2.3% | 8.0% |
| Standard Deviation (Sample) | 2.8% | 12.6% |
| Standard Deviation (Population) | 2.7% | 12.5% |
Similar Demographics by 4 or more Vehicles in Household
Demographics Similar to Sudanese by 4 or more Vehicles in Household
In terms of 4 or more vehicles in household, the demographic groups most similar to Sudanese are Uruguayan (5.6%, a difference of 0.090%), Bermudan (5.6%, a difference of 0.11%), Immigrants from Saudi Arabia (5.6%, a difference of 0.20%), Immigrants from France (5.6%, a difference of 0.27%), and Immigrants from Lithuania (5.6%, a difference of 0.30%).
| Demographics | Rating | Rank | 4 or more Vehicles in Household |
| Immigrants | Panama | 1.5 /100 | #254 | Tragic 5.7% |
| Yup'ik | 1.5 /100 | #255 | Tragic 5.7% |
| Immigrants | Turkey | 1.5 /100 | #256 | Tragic 5.7% |
| Immigrants | Northern Africa | 1.4 /100 | #257 | Tragic 5.6% |
| Immigrants | Lithuania | 1.4 /100 | #258 | Tragic 5.6% |
| Immigrants | France | 1.3 /100 | #259 | Tragic 5.6% |
| Uruguayans | 1.3 /100 | #260 | Tragic 5.6% |
| Sudanese | 1.2 /100 | #261 | Tragic 5.6% |
| Bermudans | 1.2 /100 | #262 | Tragic 5.6% |
| Immigrants | Saudi Arabia | 1.1 /100 | #263 | Tragic 5.6% |
| Immigrants | Africa | 1.0 /100 | #264 | Tragic 5.6% |
| South Americans | 0.9 /100 | #265 | Tragic 5.6% |
| Immigrants | Nepal | 0.9 /100 | #266 | Tragic 5.6% |
| Immigrants | Ukraine | 0.9 /100 | #267 | Tragic 5.6% |
| Colombians | 0.7 /100 | #268 | Tragic 5.5% |
Demographics Similar to Hungarians by 4 or more Vehicles in Household
In terms of 4 or more vehicles in household, the demographic groups most similar to Hungarians are Chilean (6.4%, a difference of 0.010%), Immigrants from Peru (6.4%, a difference of 0.14%), Immigrants from Pakistan (6.4%, a difference of 0.22%), Immigrants from Cameroon (6.4%, a difference of 0.35%), and Immigrants from Denmark (6.4%, a difference of 0.35%).
| Demographics | Rating | Rank | 4 or more Vehicles in Household |
| Peruvians | 69.4 /100 | #157 | Good 6.5% |
| Zimbabweans | 67.1 /100 | #158 | Good 6.4% |
| Indians (Asian) | 66.3 /100 | #159 | Good 6.4% |
| Palestinians | 65.8 /100 | #160 | Good 6.4% |
| Immigrants | Cameroon | 64.4 /100 | #161 | Good 6.4% |
| Immigrants | Pakistan | 63.2 /100 | #162 | Good 6.4% |
| Chileans | 61.2 /100 | #163 | Good 6.4% |
| Hungarians | 61.1 /100 | #164 | Good 6.4% |
| Immigrants | Peru | 59.8 /100 | #165 | Average 6.4% |
| Immigrants | Denmark | 57.8 /100 | #166 | Average 6.4% |
| Poles | 56.9 /100 | #167 | Average 6.4% |
| Lebanese | 55.8 /100 | #168 | Average 6.4% |
| Estonians | 55.1 /100 | #169 | Average 6.4% |
| Immigrants | Syria | 52.8 /100 | #170 | Average 6.3% |
| Immigrants | India | 51.9 /100 | #171 | Average 6.3% |