Sudanese vs Immigrants from Caribbean 4 or more Vehicles in Household
COMPARE
Sudanese
Immigrants from Caribbean
4 or more Vehicles in Household
4 or more Vehicles in Household Comparison
Sudanese
Immigrants from Caribbean
5.6%
4 OR MORE VEHICLES IN HOUSEHOLD
1.2/ 100
METRIC RATING
261st/ 347
METRIC RANK
4.4%
4 OR MORE VEHICLES IN HOUSEHOLD
0.0/ 100
METRIC RATING
323rd/ 347
METRIC RANK
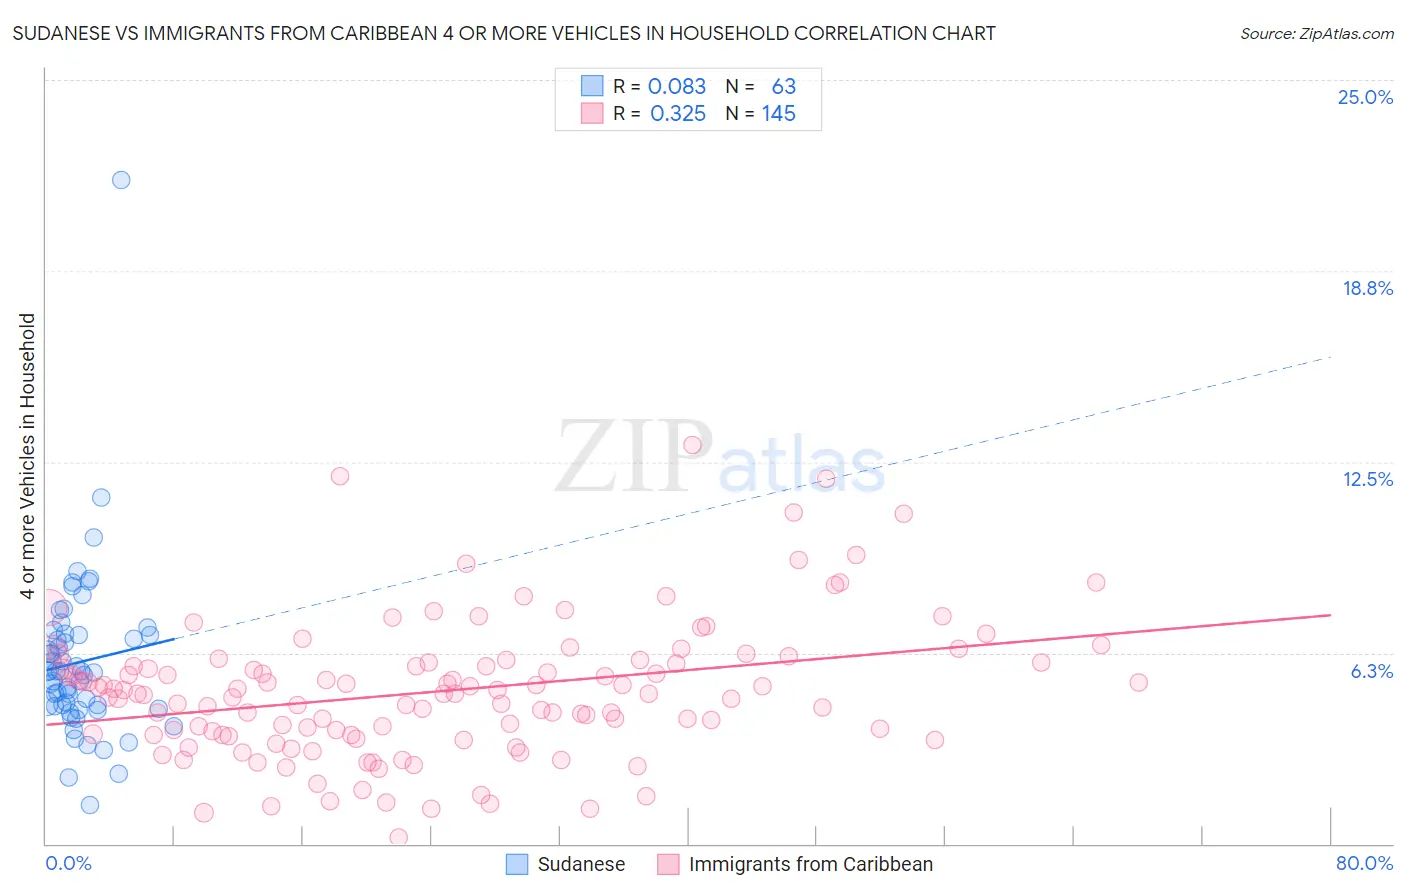
Sudanese vs Immigrants from Caribbean 4 or more Vehicles in Household Correlation Chart
The statistical analysis conducted on geographies consisting of 109,909,032 people shows a slight positive correlation between the proportion of Sudanese and percentage of households with 4 or more vehicles available in the United States with a correlation coefficient (R) of 0.083 and weighted average of 5.6%. Similarly, the statistical analysis conducted on geographies consisting of 447,619,354 people shows a mild positive correlation between the proportion of Immigrants from Caribbean and percentage of households with 4 or more vehicles available in the United States with a correlation coefficient (R) of 0.325 and weighted average of 4.4%, a difference of 26.7%.
4 or more Vehicles in Household Correlation Summary
| Measurement | Sudanese | Immigrants from Caribbean |
| Minimum | 1.3% | 0.20% |
| Maximum | 21.7% | 13.0% |
| Range | 20.5% | 12.8% |
| Mean | 5.9% | 5.0% |
| Median | 5.6% | 4.9% |
| Interquartile 25% (IQ1) | 4.5% | 3.6% |
| Interquartile 75% (IQ3) | 6.9% | 5.9% |
| Interquartile Range (IQR) | 2.3% | 2.4% |
| Standard Deviation (Sample) | 2.8% | 2.2% |
| Standard Deviation (Population) | 2.7% | 2.2% |
Similar Demographics by 4 or more Vehicles in Household
Demographics Similar to Sudanese by 4 or more Vehicles in Household
In terms of 4 or more vehicles in household, the demographic groups most similar to Sudanese are Uruguayan (5.6%, a difference of 0.090%), Bermudan (5.6%, a difference of 0.11%), Immigrants from Saudi Arabia (5.6%, a difference of 0.20%), Immigrants from France (5.6%, a difference of 0.27%), and Immigrants from Lithuania (5.6%, a difference of 0.30%).
| Demographics | Rating | Rank | 4 or more Vehicles in Household |
| Immigrants | Panama | 1.5 /100 | #254 | Tragic 5.7% |
| Yup'ik | 1.5 /100 | #255 | Tragic 5.7% |
| Immigrants | Turkey | 1.5 /100 | #256 | Tragic 5.7% |
| Immigrants | Northern Africa | 1.4 /100 | #257 | Tragic 5.6% |
| Immigrants | Lithuania | 1.4 /100 | #258 | Tragic 5.6% |
| Immigrants | France | 1.3 /100 | #259 | Tragic 5.6% |
| Uruguayans | 1.3 /100 | #260 | Tragic 5.6% |
| Sudanese | 1.2 /100 | #261 | Tragic 5.6% |
| Bermudans | 1.2 /100 | #262 | Tragic 5.6% |
| Immigrants | Saudi Arabia | 1.1 /100 | #263 | Tragic 5.6% |
| Immigrants | Africa | 1.0 /100 | #264 | Tragic 5.6% |
| South Americans | 0.9 /100 | #265 | Tragic 5.6% |
| Immigrants | Nepal | 0.9 /100 | #266 | Tragic 5.6% |
| Immigrants | Ukraine | 0.9 /100 | #267 | Tragic 5.6% |
| Colombians | 0.7 /100 | #268 | Tragic 5.5% |
Demographics Similar to Immigrants from Caribbean by 4 or more Vehicles in Household
In terms of 4 or more vehicles in household, the demographic groups most similar to Immigrants from Caribbean are Soviet Union (4.4%, a difference of 0.28%), Immigrants from Yemen (4.5%, a difference of 0.40%), Ecuadorian (4.5%, a difference of 0.58%), Immigrants from Jamaica (4.4%, a difference of 0.60%), and Cape Verdean (4.4%, a difference of 0.92%).
| Demographics | Rating | Rank | 4 or more Vehicles in Household |
| Puerto Ricans | 0.0 /100 | #316 | Tragic 4.7% |
| U.S. Virgin Islanders | 0.0 /100 | #317 | Tragic 4.6% |
| Jamaicans | 0.0 /100 | #318 | Tragic 4.6% |
| Haitians | 0.0 /100 | #319 | Tragic 4.6% |
| Immigrants | Haiti | 0.0 /100 | #320 | Tragic 4.5% |
| Ecuadorians | 0.0 /100 | #321 | Tragic 4.5% |
| Immigrants | Yemen | 0.0 /100 | #322 | Tragic 4.5% |
| Immigrants | Caribbean | 0.0 /100 | #323 | Tragic 4.4% |
| Soviet Union | 0.0 /100 | #324 | Tragic 4.4% |
| Immigrants | Jamaica | 0.0 /100 | #325 | Tragic 4.4% |
| Cape Verdeans | 0.0 /100 | #326 | Tragic 4.4% |
| Senegalese | 0.0 /100 | #327 | Tragic 4.3% |
| Trinidadians and Tobagonians | 0.0 /100 | #328 | Tragic 4.3% |
| Immigrants | Senegal | 0.0 /100 | #329 | Tragic 4.2% |
| Immigrants | Ecuador | 0.0 /100 | #330 | Tragic 4.2% |