Sudanese vs Iroquois 4 or more Vehicles in Household
COMPARE
Sudanese
Iroquois
4 or more Vehicles in Household
4 or more Vehicles in Household Comparison
Sudanese
Iroquois
5.6%
4 OR MORE VEHICLES IN HOUSEHOLD
1.2/ 100
METRIC RATING
261st/ 347
METRIC RANK
6.5%
4 OR MORE VEHICLES IN HOUSEHOLD
70.4/ 100
METRIC RATING
155th/ 347
METRIC RANK
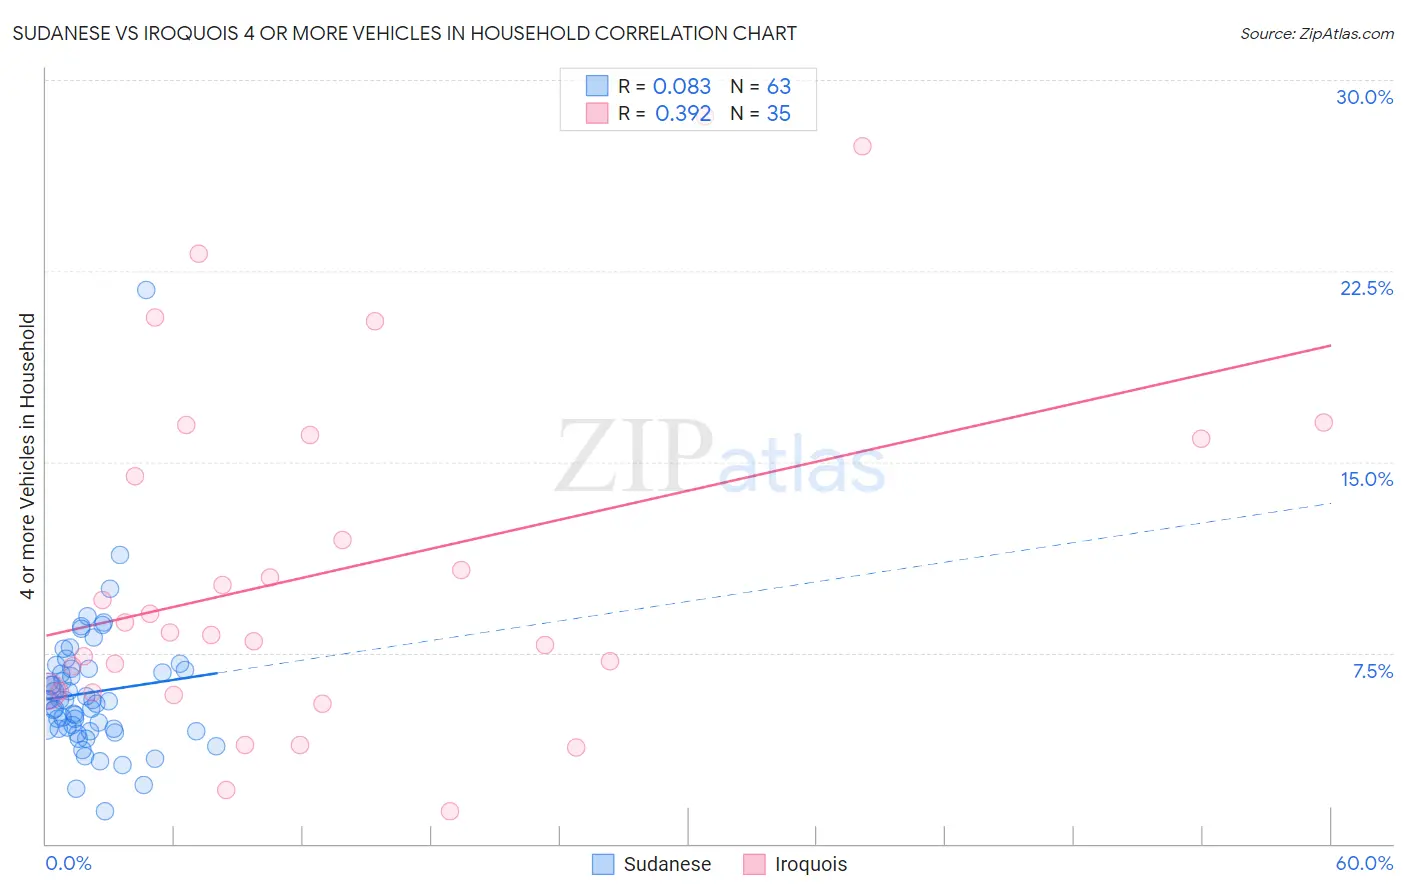
Sudanese vs Iroquois 4 or more Vehicles in Household Correlation Chart
The statistical analysis conducted on geographies consisting of 109,909,032 people shows a slight positive correlation between the proportion of Sudanese and percentage of households with 4 or more vehicles available in the United States with a correlation coefficient (R) of 0.083 and weighted average of 5.6%. Similarly, the statistical analysis conducted on geographies consisting of 206,658,365 people shows a mild positive correlation between the proportion of Iroquois and percentage of households with 4 or more vehicles available in the United States with a correlation coefficient (R) of 0.392 and weighted average of 6.5%, a difference of 14.9%.
4 or more Vehicles in Household Correlation Summary
| Measurement | Sudanese | Iroquois |
| Minimum | 1.3% | 1.3% |
| Maximum | 21.7% | 28.6% |
| Range | 20.5% | 27.3% |
| Mean | 5.9% | 10.7% |
| Median | 5.6% | 8.3% |
| Interquartile 25% (IQ1) | 4.5% | 6.0% |
| Interquartile 75% (IQ3) | 6.9% | 15.9% |
| Interquartile Range (IQR) | 2.3% | 9.9% |
| Standard Deviation (Sample) | 2.8% | 6.9% |
| Standard Deviation (Population) | 2.7% | 6.8% |
Similar Demographics by 4 or more Vehicles in Household
Demographics Similar to Sudanese by 4 or more Vehicles in Household
In terms of 4 or more vehicles in household, the demographic groups most similar to Sudanese are Uruguayan (5.6%, a difference of 0.090%), Bermudan (5.6%, a difference of 0.11%), Immigrants from Saudi Arabia (5.6%, a difference of 0.20%), Immigrants from France (5.6%, a difference of 0.27%), and Immigrants from Lithuania (5.6%, a difference of 0.30%).
| Demographics | Rating | Rank | 4 or more Vehicles in Household |
| Immigrants | Panama | 1.5 /100 | #254 | Tragic 5.7% |
| Yup'ik | 1.5 /100 | #255 | Tragic 5.7% |
| Immigrants | Turkey | 1.5 /100 | #256 | Tragic 5.7% |
| Immigrants | Northern Africa | 1.4 /100 | #257 | Tragic 5.6% |
| Immigrants | Lithuania | 1.4 /100 | #258 | Tragic 5.6% |
| Immigrants | France | 1.3 /100 | #259 | Tragic 5.6% |
| Uruguayans | 1.3 /100 | #260 | Tragic 5.6% |
| Sudanese | 1.2 /100 | #261 | Tragic 5.6% |
| Bermudans | 1.2 /100 | #262 | Tragic 5.6% |
| Immigrants | Saudi Arabia | 1.1 /100 | #263 | Tragic 5.6% |
| Immigrants | Africa | 1.0 /100 | #264 | Tragic 5.6% |
| South Americans | 0.9 /100 | #265 | Tragic 5.6% |
| Immigrants | Nepal | 0.9 /100 | #266 | Tragic 5.6% |
| Immigrants | Ukraine | 0.9 /100 | #267 | Tragic 5.6% |
| Colombians | 0.7 /100 | #268 | Tragic 5.5% |
Demographics Similar to Iroquois by 4 or more Vehicles in Household
In terms of 4 or more vehicles in household, the demographic groups most similar to Iroquois are Iranian (6.5%, a difference of 0.060%), Central American Indian (6.5%, a difference of 0.080%), Immigrants from Armenia (6.5%, a difference of 0.090%), Peruvian (6.5%, a difference of 0.11%), and Yuman (6.5%, a difference of 0.21%).
| Demographics | Rating | Rank | 4 or more Vehicles in Household |
| Immigrants | Jordan | 73.7 /100 | #148 | Good 6.5% |
| Greeks | 73.6 /100 | #149 | Good 6.5% |
| New Zealanders | 73.3 /100 | #150 | Good 6.5% |
| Immigrants | Hong Kong | 72.2 /100 | #151 | Good 6.5% |
| Yuman | 72.1 /100 | #152 | Good 6.5% |
| Immigrants | Armenia | 71.2 /100 | #153 | Good 6.5% |
| Central American Indians | 71.1 /100 | #154 | Good 6.5% |
| Iroquois | 70.4 /100 | #155 | Good 6.5% |
| Iranians | 69.9 /100 | #156 | Good 6.5% |
| Peruvians | 69.4 /100 | #157 | Good 6.5% |
| Zimbabweans | 67.1 /100 | #158 | Good 6.4% |
| Indians (Asian) | 66.3 /100 | #159 | Good 6.4% |
| Palestinians | 65.8 /100 | #160 | Good 6.4% |
| Immigrants | Cameroon | 64.4 /100 | #161 | Good 6.4% |
| Immigrants | Pakistan | 63.2 /100 | #162 | Good 6.4% |