Sudanese vs Immigrants from Africa 4 or more Vehicles in Household
COMPARE
Sudanese
Immigrants from Africa
4 or more Vehicles in Household
4 or more Vehicles in Household Comparison
Sudanese
Immigrants from Africa
5.6%
4 OR MORE VEHICLES IN HOUSEHOLD
1.2/ 100
METRIC RATING
261st/ 347
METRIC RANK
5.6%
4 OR MORE VEHICLES IN HOUSEHOLD
1.0/ 100
METRIC RATING
264th/ 347
METRIC RANK
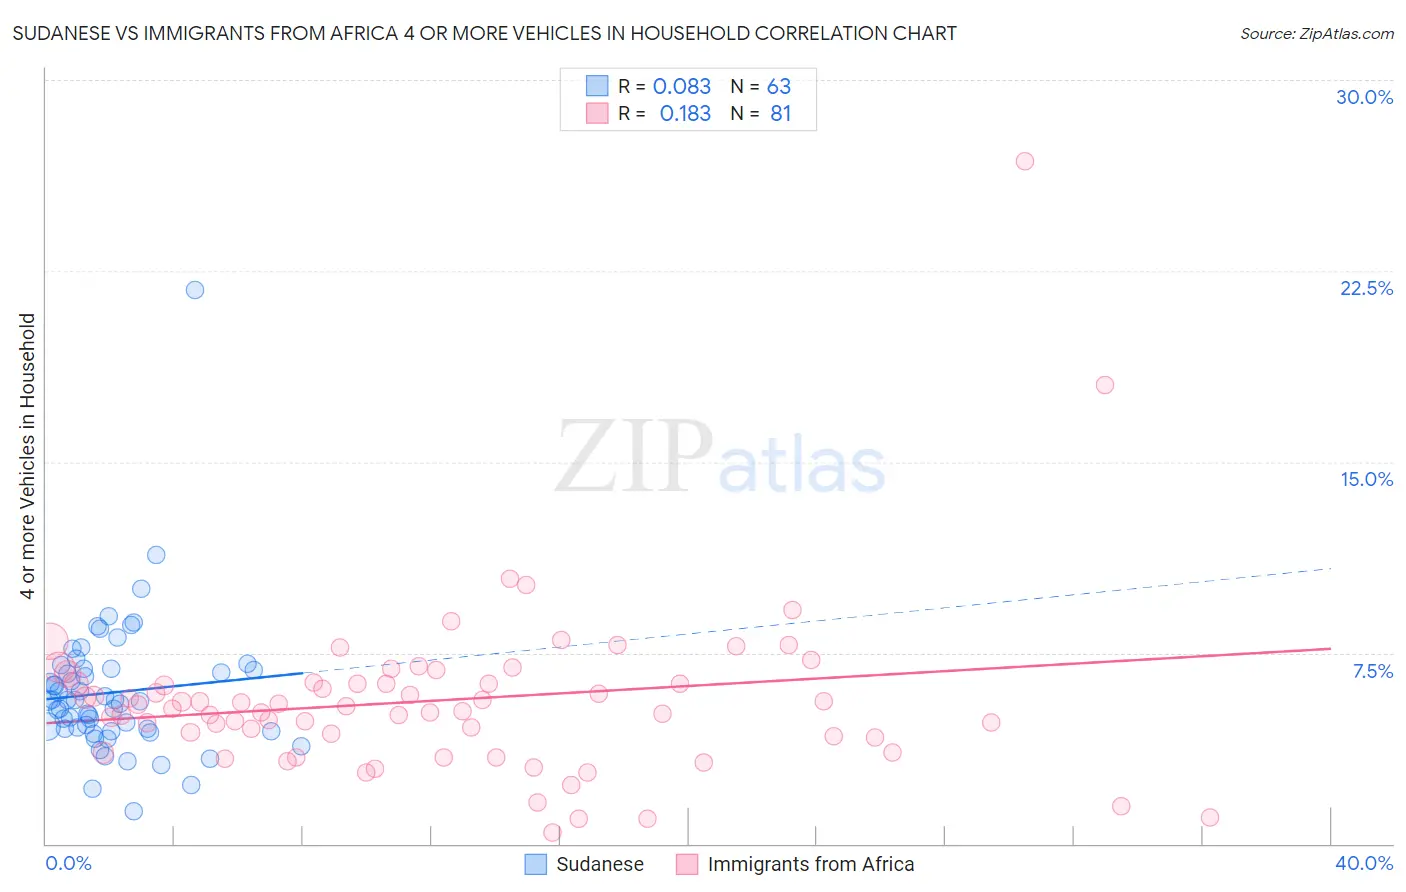
Sudanese vs Immigrants from Africa 4 or more Vehicles in Household Correlation Chart
The statistical analysis conducted on geographies consisting of 109,909,032 people shows a slight positive correlation between the proportion of Sudanese and percentage of households with 4 or more vehicles available in the United States with a correlation coefficient (R) of 0.083 and weighted average of 5.6%. Similarly, the statistical analysis conducted on geographies consisting of 466,853,730 people shows a poor positive correlation between the proportion of Immigrants from Africa and percentage of households with 4 or more vehicles available in the United States with a correlation coefficient (R) of 0.183 and weighted average of 5.6%, a difference of 0.74%.
4 or more Vehicles in Household Correlation Summary
| Measurement | Sudanese | Immigrants from Africa |
| Minimum | 1.3% | 0.46% |
| Maximum | 21.7% | 26.8% |
| Range | 20.5% | 26.3% |
| Mean | 5.9% | 5.6% |
| Median | 5.6% | 5.4% |
| Interquartile 25% (IQ1) | 4.5% | 4.2% |
| Interquartile 75% (IQ3) | 6.9% | 6.3% |
| Interquartile Range (IQR) | 2.3% | 2.1% |
| Standard Deviation (Sample) | 2.8% | 3.4% |
| Standard Deviation (Population) | 2.7% | 3.4% |
Demographics Similar to Sudanese and Immigrants from Africa by 4 or more Vehicles in Household
In terms of 4 or more vehicles in household, the demographic groups most similar to Sudanese are Uruguayan (5.6%, a difference of 0.090%), Bermudan (5.6%, a difference of 0.11%), Immigrants from Saudi Arabia (5.6%, a difference of 0.20%), Immigrants from France (5.6%, a difference of 0.27%), and Immigrants from Lithuania (5.6%, a difference of 0.30%). Similarly, the demographic groups most similar to Immigrants from Africa are South American (5.6%, a difference of 0.22%), Immigrants from Nepal (5.6%, a difference of 0.24%), Immigrants from Ukraine (5.6%, a difference of 0.32%), Immigrants from Saudi Arabia (5.6%, a difference of 0.54%), and Bermudan (5.6%, a difference of 0.63%).
| Demographics | Rating | Rank | 4 or more Vehicles in Household |
| Sub-Saharan Africans | 2.1 /100 | #252 | Tragic 5.7% |
| Immigrants | Cuba | 1.6 /100 | #253 | Tragic 5.7% |
| Immigrants | Panama | 1.5 /100 | #254 | Tragic 5.7% |
| Yup'ik | 1.5 /100 | #255 | Tragic 5.7% |
| Immigrants | Turkey | 1.5 /100 | #256 | Tragic 5.7% |
| Immigrants | Northern Africa | 1.4 /100 | #257 | Tragic 5.6% |
| Immigrants | Lithuania | 1.4 /100 | #258 | Tragic 5.6% |
| Immigrants | France | 1.3 /100 | #259 | Tragic 5.6% |
| Uruguayans | 1.3 /100 | #260 | Tragic 5.6% |
| Sudanese | 1.2 /100 | #261 | Tragic 5.6% |
| Bermudans | 1.2 /100 | #262 | Tragic 5.6% |
| Immigrants | Saudi Arabia | 1.1 /100 | #263 | Tragic 5.6% |
| Immigrants | Africa | 1.0 /100 | #264 | Tragic 5.6% |
| South Americans | 0.9 /100 | #265 | Tragic 5.6% |
| Immigrants | Nepal | 0.9 /100 | #266 | Tragic 5.6% |
| Immigrants | Ukraine | 0.9 /100 | #267 | Tragic 5.6% |
| Colombians | 0.7 /100 | #268 | Tragic 5.5% |
| Carpatho Rusyns | 0.7 /100 | #269 | Tragic 5.5% |
| Okinawans | 0.6 /100 | #270 | Tragic 5.5% |
| Immigrants | Sudan | 0.6 /100 | #271 | Tragic 5.5% |
| Immigrants | Kazakhstan | 0.6 /100 | #272 | Tragic 5.5% |