Sudanese vs Hungarian Doctorate Degree
COMPARE
Sudanese
Hungarian
Doctorate Degree
Doctorate Degree Comparison
Sudanese
Hungarians
2.1%
DOCTORATE DEGREE
97.7/ 100
METRIC RATING
106th/ 347
METRIC RANK
1.9%
DOCTORATE DEGREE
71.7/ 100
METRIC RATING
158th/ 347
METRIC RANK
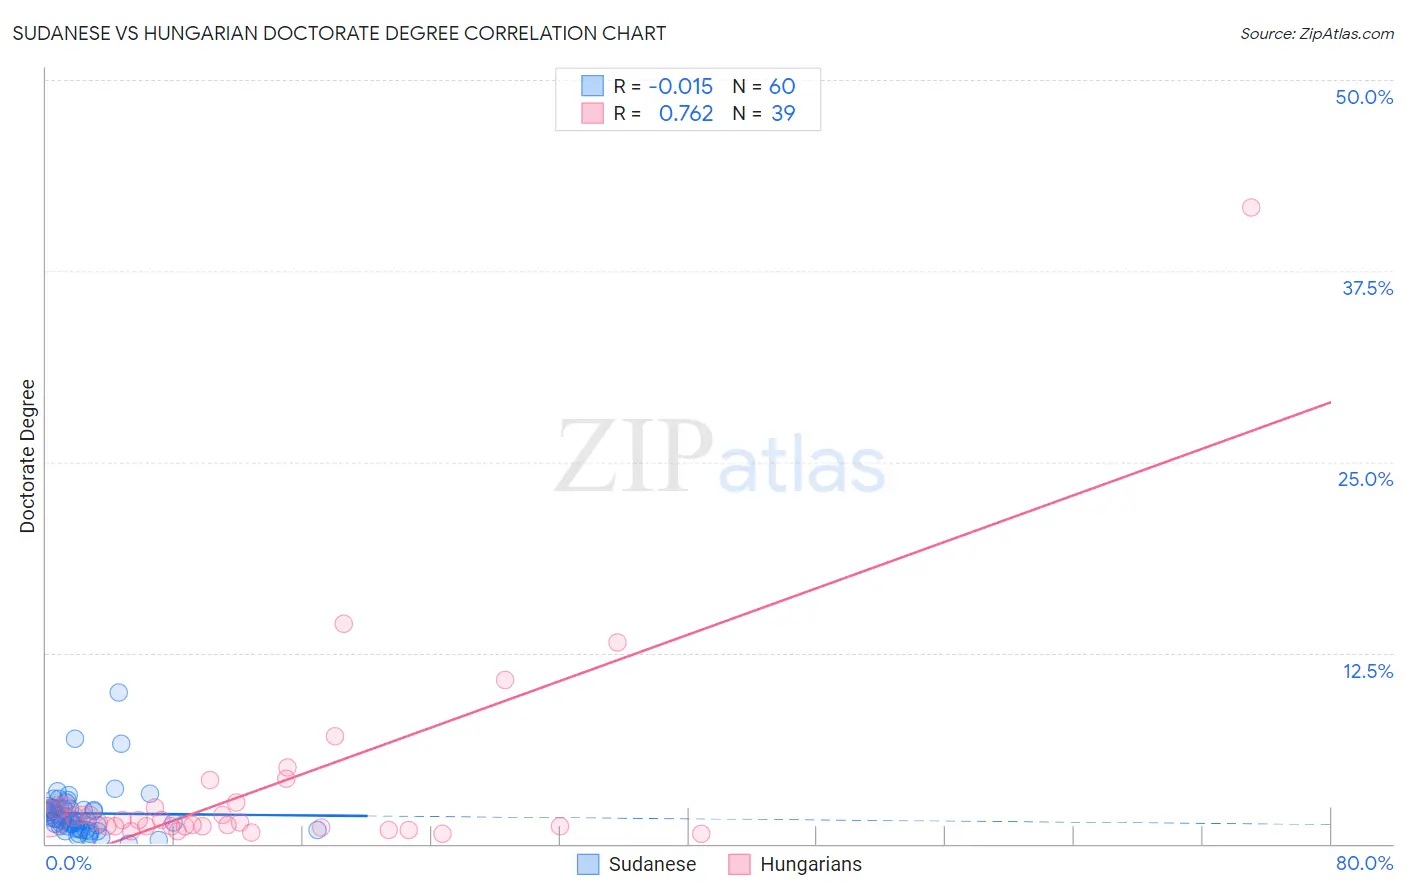
Sudanese vs Hungarian Doctorate Degree Correlation Chart
The statistical analysis conducted on geographies consisting of 109,863,748 people shows no correlation between the proportion of Sudanese and percentage of population with at least doctorate degree education in the United States with a correlation coefficient (R) of -0.015 and weighted average of 2.1%. Similarly, the statistical analysis conducted on geographies consisting of 477,129,371 people shows a strong positive correlation between the proportion of Hungarians and percentage of population with at least doctorate degree education in the United States with a correlation coefficient (R) of 0.762 and weighted average of 1.9%, a difference of 10.1%.
Doctorate Degree Correlation Summary
| Measurement | Sudanese | Hungarian |
| Minimum | 0.038% | 0.65% |
| Maximum | 9.9% | 41.7% |
| Range | 9.9% | 41.0% |
| Mean | 2.0% | 3.7% |
| Median | 1.6% | 1.5% |
| Interquartile 25% (IQ1) | 1.1% | 1.1% |
| Interquartile 75% (IQ3) | 2.3% | 2.5% |
| Interquartile Range (IQR) | 1.2% | 1.3% |
| Standard Deviation (Sample) | 1.6% | 7.0% |
| Standard Deviation (Population) | 1.6% | 6.9% |
Similar Demographics by Doctorate Degree
Demographics Similar to Sudanese by Doctorate Degree
In terms of doctorate degree, the demographic groups most similar to Sudanese are Arab (2.1%, a difference of 0.10%), European (2.1%, a difference of 0.39%), Austrian (2.1%, a difference of 0.45%), Romanian (2.1%, a difference of 0.57%), and Immigrants from Chile (2.1%, a difference of 0.58%).
| Demographics | Rating | Rank | Doctorate Degree |
| Immigrants | Egypt | 98.2 /100 | #99 | Exceptional 2.1% |
| Immigrants | Eastern Europe | 98.2 /100 | #100 | Exceptional 2.1% |
| Immigrants | Eastern Africa | 98.2 /100 | #101 | Exceptional 2.1% |
| Immigrants | Chile | 98.1 /100 | #102 | Exceptional 2.1% |
| Romanians | 98.1 /100 | #103 | Exceptional 2.1% |
| Austrians | 98.0 /100 | #104 | Exceptional 2.1% |
| Arabs | 97.8 /100 | #105 | Exceptional 2.1% |
| Sudanese | 97.7 /100 | #106 | Exceptional 2.1% |
| Europeans | 97.5 /100 | #107 | Exceptional 2.1% |
| Immigrants | Germany | 97.3 /100 | #108 | Exceptional 2.1% |
| Ukrainians | 97.2 /100 | #109 | Exceptional 2.1% |
| Brazilians | 97.2 /100 | #110 | Exceptional 2.1% |
| Immigrants | Pakistan | 97.1 /100 | #111 | Exceptional 2.1% |
| Syrians | 97.1 /100 | #112 | Exceptional 2.1% |
| Immigrants | Italy | 96.9 /100 | #113 | Exceptional 2.1% |
Demographics Similar to Hungarians by Doctorate Degree
In terms of doctorate degree, the demographic groups most similar to Hungarians are Danish (1.9%, a difference of 0.030%), Slavic (1.9%, a difference of 0.11%), Polish (1.9%, a difference of 0.17%), Immigrants from Albania (1.9%, a difference of 0.19%), and Slovene (1.9%, a difference of 0.26%).
| Demographics | Rating | Rank | Doctorate Degree |
| Albanians | 74.8 /100 | #151 | Good 1.9% |
| Immigrants | Kenya | 74.3 /100 | #152 | Good 1.9% |
| Immigrants | Oceania | 74.0 /100 | #153 | Good 1.9% |
| Immigrants | Albania | 72.8 /100 | #154 | Good 1.9% |
| Poles | 72.7 /100 | #155 | Good 1.9% |
| Slavs | 72.4 /100 | #156 | Good 1.9% |
| Danes | 71.9 /100 | #157 | Good 1.9% |
| Hungarians | 71.7 /100 | #158 | Good 1.9% |
| Slovenes | 70.2 /100 | #159 | Good 1.9% |
| Welsh | 69.7 /100 | #160 | Good 1.9% |
| Immigrants | Middle Africa | 68.8 /100 | #161 | Good 1.9% |
| Irish | 67.5 /100 | #162 | Good 1.9% |
| Czechs | 67.3 /100 | #163 | Good 1.9% |
| Celtics | 66.7 /100 | #164 | Good 1.9% |
| Scotch-Irish | 63.6 /100 | #165 | Good 1.9% |