Immigrants from Portugal vs Hungarian 4 or more Vehicles in Household
COMPARE
Immigrants from Portugal
Hungarian
4 or more Vehicles in Household
4 or more Vehicles in Household Comparison
Immigrants from Portugal
Hungarians
6.1%
4 OR MORE VEHICLES IN HOUSEHOLD
22.3/ 100
METRIC RATING
198th/ 347
METRIC RANK
6.4%
4 OR MORE VEHICLES IN HOUSEHOLD
61.1/ 100
METRIC RATING
164th/ 347
METRIC RANK
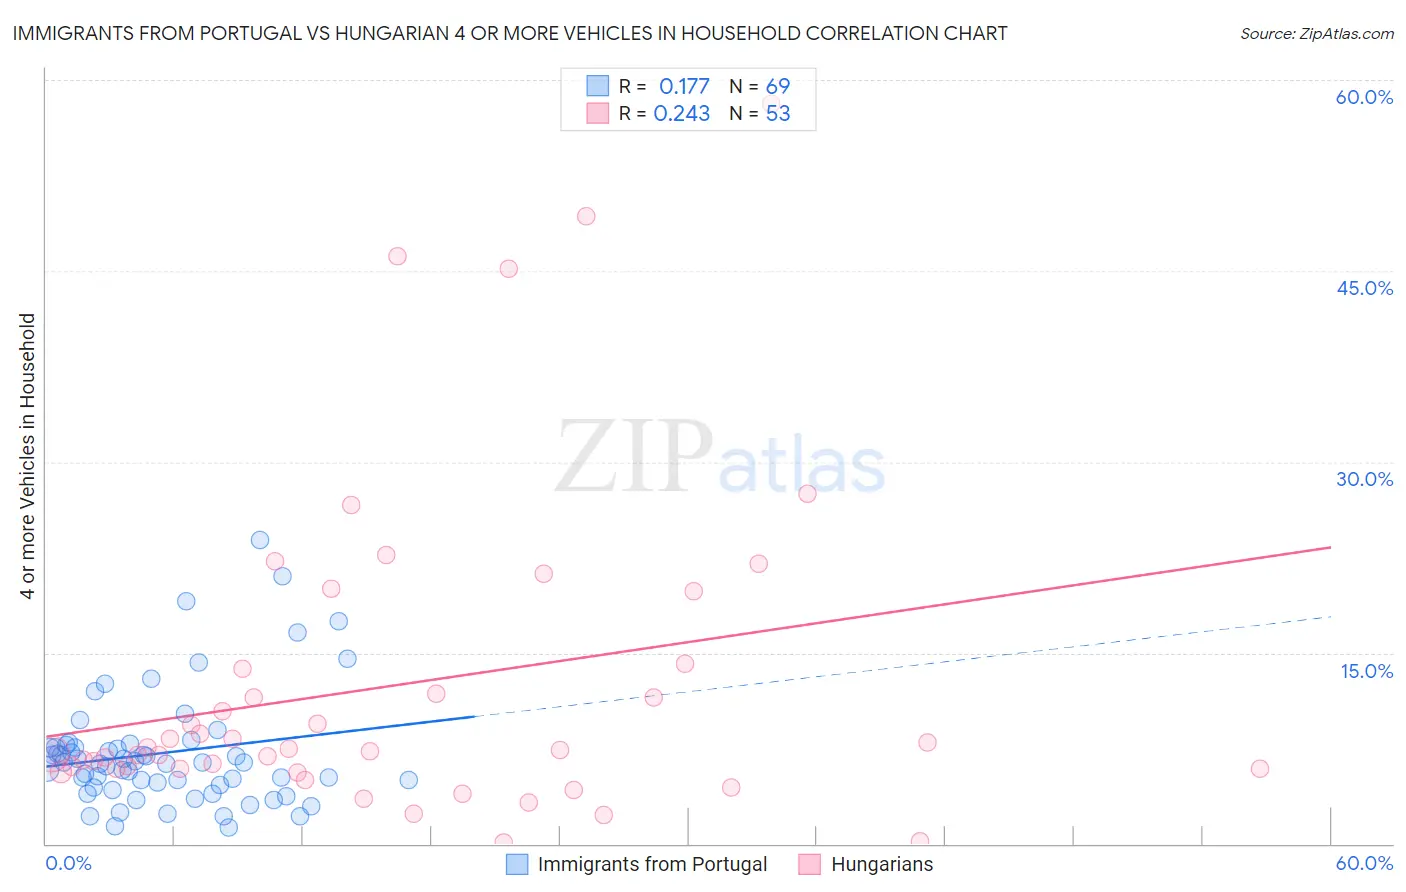
Immigrants from Portugal vs Hungarian 4 or more Vehicles in Household Correlation Chart
The statistical analysis conducted on geographies consisting of 173,887,312 people shows a poor positive correlation between the proportion of Immigrants from Portugal and percentage of households with 4 or more vehicles available in the United States with a correlation coefficient (R) of 0.177 and weighted average of 6.1%. Similarly, the statistical analysis conducted on geographies consisting of 483,846,610 people shows a weak positive correlation between the proportion of Hungarians and percentage of households with 4 or more vehicles available in the United States with a correlation coefficient (R) of 0.243 and weighted average of 6.4%, a difference of 4.4%.
4 or more Vehicles in Household Correlation Summary
| Measurement | Immigrants from Portugal | Hungarian |
| Minimum | 1.3% | 0.062% |
| Maximum | 23.9% | 58.1% |
| Range | 22.6% | 58.1% |
| Mean | 7.1% | 12.4% |
| Median | 6.4% | 7.3% |
| Interquartile 25% (IQ1) | 4.5% | 5.9% |
| Interquartile 75% (IQ3) | 7.7% | 13.9% |
| Interquartile Range (IQR) | 3.2% | 8.0% |
| Standard Deviation (Sample) | 4.5% | 12.6% |
| Standard Deviation (Population) | 4.5% | 12.5% |
Similar Demographics by 4 or more Vehicles in Household
Demographics Similar to Immigrants from Portugal by 4 or more Vehicles in Household
In terms of 4 or more vehicles in household, the demographic groups most similar to Immigrants from Portugal are Immigrants from Norway (6.1%, a difference of 0.080%), Latvian (6.1%, a difference of 0.090%), Egyptian (6.1%, a difference of 0.14%), Immigrants from South Central Asia (6.1%, a difference of 0.15%), and Immigrants from Sri Lanka (6.1%, a difference of 0.20%).
| Demographics | Rating | Rank | 4 or more Vehicles in Household |
| Inupiat | 30.7 /100 | #191 | Fair 6.2% |
| Romanians | 30.7 /100 | #192 | Fair 6.2% |
| Immigrants | Kuwait | 28.0 /100 | #193 | Fair 6.2% |
| Immigrants | Sweden | 27.0 /100 | #194 | Fair 6.2% |
| Argentineans | 27.0 /100 | #195 | Fair 6.2% |
| Tsimshian | 26.4 /100 | #196 | Fair 6.2% |
| Immigrants | Sri Lanka | 23.7 /100 | #197 | Fair 6.1% |
| Immigrants | Portugal | 22.3 /100 | #198 | Fair 6.1% |
| Immigrants | Norway | 21.8 /100 | #199 | Fair 6.1% |
| Latvians | 21.7 /100 | #200 | Fair 6.1% |
| Egyptians | 21.4 /100 | #201 | Fair 6.1% |
| Immigrants | South Central Asia | 21.3 /100 | #202 | Fair 6.1% |
| Immigrants | Sierra Leone | 20.5 /100 | #203 | Fair 6.1% |
| Immigrants | Belize | 19.8 /100 | #204 | Poor 6.1% |
| Hondurans | 19.3 /100 | #205 | Poor 6.1% |
Demographics Similar to Hungarians by 4 or more Vehicles in Household
In terms of 4 or more vehicles in household, the demographic groups most similar to Hungarians are Chilean (6.4%, a difference of 0.010%), Immigrants from Peru (6.4%, a difference of 0.14%), Immigrants from Pakistan (6.4%, a difference of 0.22%), Immigrants from Cameroon (6.4%, a difference of 0.35%), and Immigrants from Denmark (6.4%, a difference of 0.35%).
| Demographics | Rating | Rank | 4 or more Vehicles in Household |
| Peruvians | 69.4 /100 | #157 | Good 6.5% |
| Zimbabweans | 67.1 /100 | #158 | Good 6.4% |
| Indians (Asian) | 66.3 /100 | #159 | Good 6.4% |
| Palestinians | 65.8 /100 | #160 | Good 6.4% |
| Immigrants | Cameroon | 64.4 /100 | #161 | Good 6.4% |
| Immigrants | Pakistan | 63.2 /100 | #162 | Good 6.4% |
| Chileans | 61.2 /100 | #163 | Good 6.4% |
| Hungarians | 61.1 /100 | #164 | Good 6.4% |
| Immigrants | Peru | 59.8 /100 | #165 | Average 6.4% |
| Immigrants | Denmark | 57.8 /100 | #166 | Average 6.4% |
| Poles | 56.9 /100 | #167 | Average 6.4% |
| Lebanese | 55.8 /100 | #168 | Average 6.4% |
| Estonians | 55.1 /100 | #169 | Average 6.4% |
| Immigrants | Syria | 52.8 /100 | #170 | Average 6.3% |
| Immigrants | India | 51.9 /100 | #171 | Average 6.3% |