Spaniard vs Colombian 1 or more Vehicles in Household
COMPARE
Spaniard
Colombian
1 or more Vehicles in Household
1 or more Vehicles in Household Comparison
Spaniards
Colombians
91.8%
1 OR MORE VEHICLES IN HOUSEHOLD
99.8/ 100
METRIC RATING
67th/ 347
METRIC RANK
88.0%
1 OR MORE VEHICLES IN HOUSEHOLD
0.9/ 100
METRIC RATING
256th/ 347
METRIC RANK
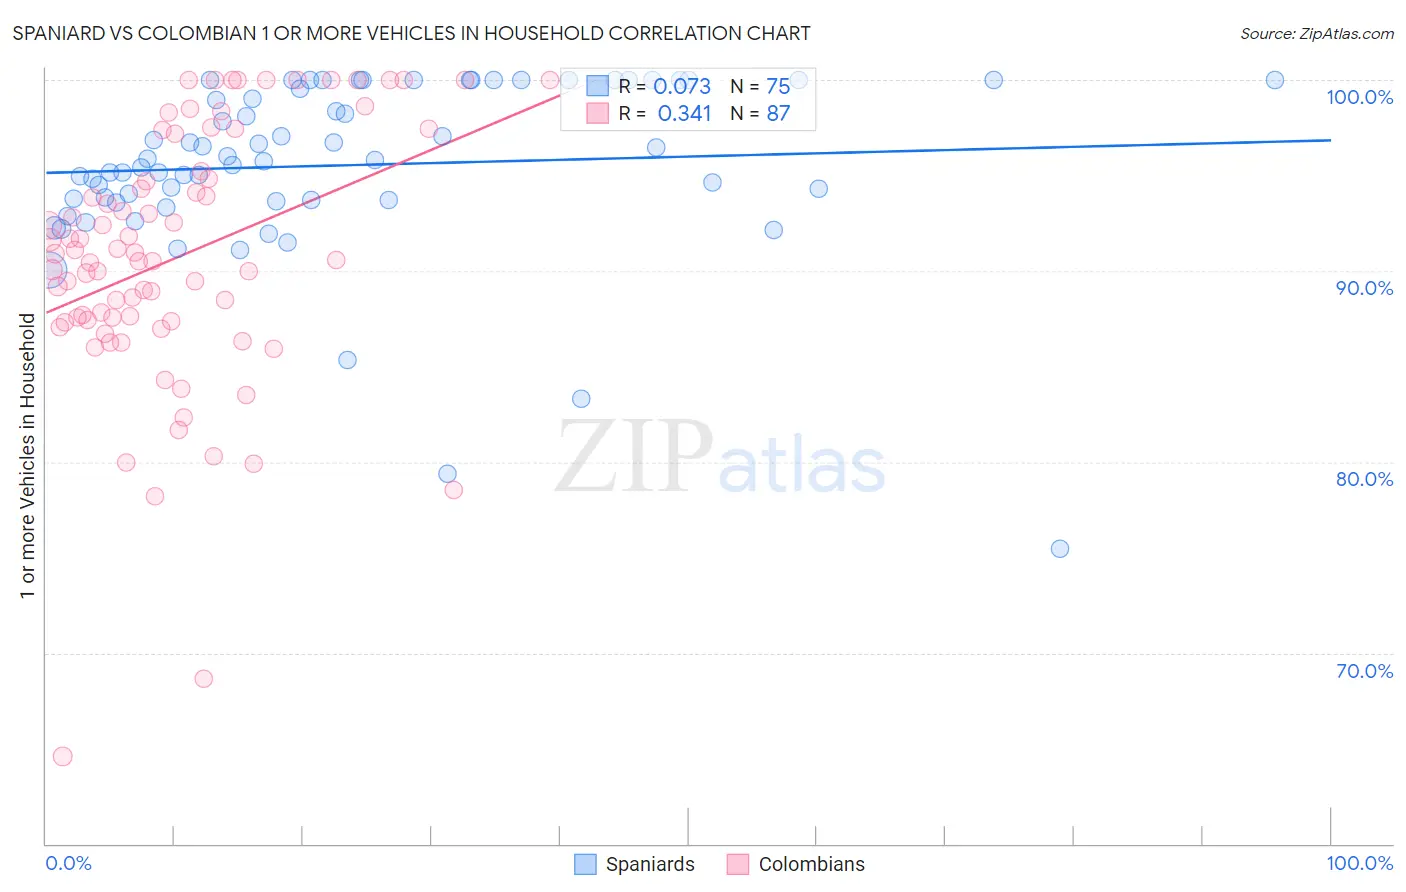
Spaniard vs Colombian 1 or more Vehicles in Household Correlation Chart
The statistical analysis conducted on geographies consisting of 443,238,522 people shows a slight positive correlation between the proportion of Spaniards and percentage of households with 1 or more vehicles available in the United States with a correlation coefficient (R) of 0.073 and weighted average of 91.8%. Similarly, the statistical analysis conducted on geographies consisting of 419,307,896 people shows a mild positive correlation between the proportion of Colombians and percentage of households with 1 or more vehicles available in the United States with a correlation coefficient (R) of 0.341 and weighted average of 88.0%, a difference of 4.3%.
1 or more Vehicles in Household Correlation Summary
| Measurement | Spaniard | Colombian |
| Minimum | 75.5% | 64.6% |
| Maximum | 100.0% | 100.0% |
| Range | 24.5% | 35.4% |
| Mean | 95.5% | 90.7% |
| Median | 95.8% | 90.6% |
| Interquartile 25% (IQ1) | 93.7% | 87.4% |
| Interquartile 75% (IQ3) | 100.0% | 95.2% |
| Interquartile Range (IQR) | 6.3% | 7.9% |
| Standard Deviation (Sample) | 4.6% | 6.8% |
| Standard Deviation (Population) | 4.6% | 6.8% |
Similar Demographics by 1 or more Vehicles in Household
Demographics Similar to Spaniards by 1 or more Vehicles in Household
In terms of 1 or more vehicles in household, the demographic groups most similar to Spaniards are Canadian (91.8%, a difference of 0.020%), Immigrants from Scotland (91.8%, a difference of 0.030%), Immigrants from Laos (91.8%, a difference of 0.040%), Croatian (91.9%, a difference of 0.070%), and Palestinian (91.7%, a difference of 0.070%).
| Demographics | Rating | Rank | 1 or more Vehicles in Household |
| Slovaks | 99.8 /100 | #60 | Exceptional 91.9% |
| Immigrants | India | 99.8 /100 | #61 | Exceptional 91.9% |
| Thais | 99.8 /100 | #62 | Exceptional 91.9% |
| Chinese | 99.8 /100 | #63 | Exceptional 91.9% |
| Croatians | 99.8 /100 | #64 | Exceptional 91.9% |
| Immigrants | Laos | 99.8 /100 | #65 | Exceptional 91.8% |
| Canadians | 99.8 /100 | #66 | Exceptional 91.8% |
| Spaniards | 99.8 /100 | #67 | Exceptional 91.8% |
| Immigrants | Scotland | 99.7 /100 | #68 | Exceptional 91.8% |
| Palestinians | 99.7 /100 | #69 | Exceptional 91.7% |
| Lithuanians | 99.7 /100 | #70 | Exceptional 91.7% |
| Poles | 99.7 /100 | #71 | Exceptional 91.7% |
| Cajuns | 99.7 /100 | #72 | Exceptional 91.7% |
| Immigrants | Iran | 99.7 /100 | #73 | Exceptional 91.7% |
| Immigrants | Lebanon | 99.6 /100 | #74 | Exceptional 91.6% |
Demographics Similar to Colombians by 1 or more Vehicles in Household
In terms of 1 or more vehicles in household, the demographic groups most similar to Colombians are Liberian (88.0%, a difference of 0.0%), Immigrants from Latvia (88.1%, a difference of 0.010%), South American Indian (88.0%, a difference of 0.010%), Haitian (88.1%, a difference of 0.030%), and Honduran (88.1%, a difference of 0.040%).
| Demographics | Rating | Rank | 1 or more Vehicles in Household |
| Blacks/African Americans | 1.4 /100 | #249 | Tragic 88.2% |
| Egyptians | 1.2 /100 | #250 | Tragic 88.2% |
| Immigrants | Serbia | 1.2 /100 | #251 | Tragic 88.2% |
| Immigrants | Uruguay | 1.1 /100 | #252 | Tragic 88.1% |
| Hondurans | 1.0 /100 | #253 | Tragic 88.1% |
| Haitians | 0.9 /100 | #254 | Tragic 88.1% |
| Immigrants | Latvia | 0.9 /100 | #255 | Tragic 88.1% |
| Colombians | 0.9 /100 | #256 | Tragic 88.0% |
| Liberians | 0.9 /100 | #257 | Tragic 88.0% |
| South American Indians | 0.9 /100 | #258 | Tragic 88.0% |
| Nigerians | 0.8 /100 | #259 | Tragic 88.0% |
| Macedonians | 0.6 /100 | #260 | Tragic 87.9% |
| Immigrants | Switzerland | 0.6 /100 | #261 | Tragic 87.9% |
| Sub-Saharan Africans | 0.5 /100 | #262 | Tragic 87.9% |
| Immigrants | Egypt | 0.5 /100 | #263 | Tragic 87.8% |