Spaniard vs Colombian 1st Grade
COMPARE
Spaniard
Colombian
1st Grade
1st Grade Comparison
Spaniards
Colombians
98.1%
1ST GRADE
91.2/ 100
METRIC RATING
131st/ 347
METRIC RANK
97.6%
1ST GRADE
2.2/ 100
METRIC RATING
234th/ 347
METRIC RANK
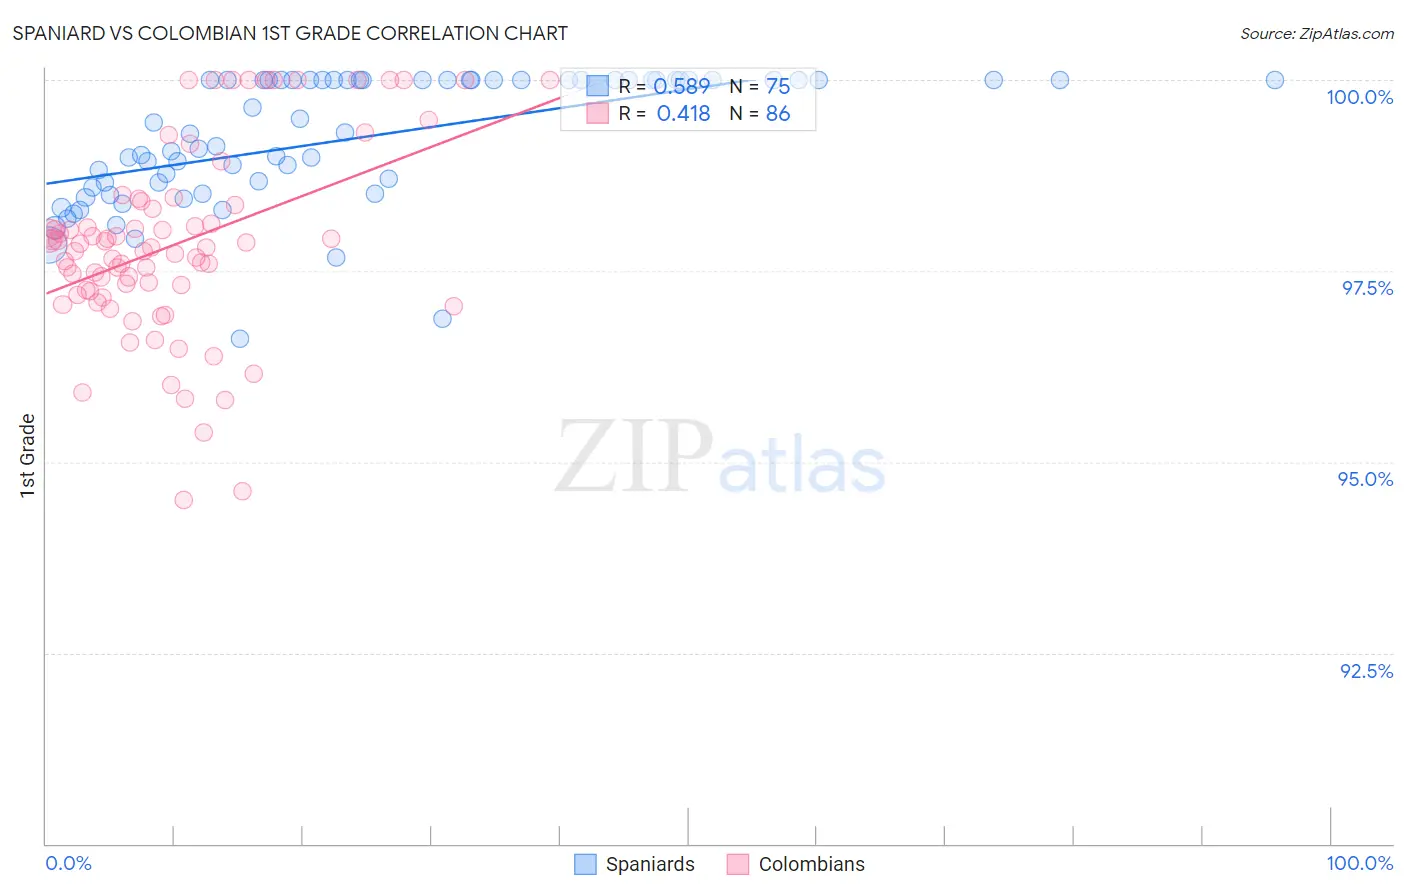
Spaniard vs Colombian 1st Grade Correlation Chart
The statistical analysis conducted on geographies consisting of 443,544,503 people shows a substantial positive correlation between the proportion of Spaniards and percentage of population with at least 1st grade education in the United States with a correlation coefficient (R) of 0.589 and weighted average of 98.1%. Similarly, the statistical analysis conducted on geographies consisting of 419,700,680 people shows a moderate positive correlation between the proportion of Colombians and percentage of population with at least 1st grade education in the United States with a correlation coefficient (R) of 0.418 and weighted average of 97.6%, a difference of 0.48%.
1st Grade Correlation Summary
| Measurement | Spaniard | Colombian |
| Minimum | 96.6% | 94.5% |
| Maximum | 100.0% | 100.0% |
| Range | 3.4% | 5.5% |
| Mean | 99.2% | 97.8% |
| Median | 99.3% | 97.8% |
| Interquartile 25% (IQ1) | 98.6% | 97.2% |
| Interquartile 75% (IQ3) | 100.0% | 98.4% |
| Interquartile Range (IQR) | 1.4% | 1.1% |
| Standard Deviation (Sample) | 0.84% | 1.2% |
| Standard Deviation (Population) | 0.84% | 1.2% |
Similar Demographics by 1st Grade
Demographics Similar to Spaniards by 1st Grade
In terms of 1st grade, the demographic groups most similar to Spaniards are Immigrants from Croatia (98.1%, a difference of 0.0%), Cambodian (98.1%, a difference of 0.0%), Immigrants from Serbia (98.1%, a difference of 0.010%), Seminole (98.1%, a difference of 0.010%), and Immigrants from Europe (98.1%, a difference of 0.010%).
| Demographics | Rating | Rank | 1st Grade |
| Syrians | 93.7 /100 | #124 | Exceptional 98.1% |
| Immigrants | Japan | 93.7 /100 | #125 | Exceptional 98.1% |
| Lebanese | 93.5 /100 | #126 | Exceptional 98.1% |
| Immigrants | Saudi Arabia | 93.3 /100 | #127 | Exceptional 98.1% |
| Immigrants | Serbia | 92.2 /100 | #128 | Exceptional 98.1% |
| Seminole | 91.9 /100 | #129 | Exceptional 98.1% |
| Immigrants | Croatia | 91.4 /100 | #130 | Exceptional 98.1% |
| Spaniards | 91.2 /100 | #131 | Exceptional 98.1% |
| Cambodians | 90.9 /100 | #132 | Exceptional 98.1% |
| Immigrants | Europe | 90.5 /100 | #133 | Exceptional 98.1% |
| Immigrants | Hungary | 89.4 /100 | #134 | Excellent 98.1% |
| Immigrants | Kuwait | 89.3 /100 | #135 | Excellent 98.1% |
| Immigrants | Bulgaria | 88.8 /100 | #136 | Excellent 98.1% |
| Israelis | 87.8 /100 | #137 | Excellent 98.1% |
| Immigrants | Romania | 87.8 /100 | #138 | Excellent 98.1% |
Demographics Similar to Colombians by 1st Grade
In terms of 1st grade, the demographic groups most similar to Colombians are Immigrants from Pakistan (97.6%, a difference of 0.0%), Immigrants from Malaysia (97.6%, a difference of 0.0%), Immigrants from Western Asia (97.6%, a difference of 0.0%), Immigrants from Uruguay (97.6%, a difference of 0.010%), and U.S. Virgin Islander (97.6%, a difference of 0.010%).
| Demographics | Rating | Rank | 1st Grade |
| Sierra Leoneans | 3.6 /100 | #227 | Tragic 97.7% |
| Sub-Saharan Africans | 3.6 /100 | #228 | Tragic 97.7% |
| Immigrants | Costa Rica | 3.5 /100 | #229 | Tragic 97.7% |
| Senegalese | 3.5 /100 | #230 | Tragic 97.7% |
| Puerto Ricans | 3.0 /100 | #231 | Tragic 97.7% |
| Immigrants | Uruguay | 2.5 /100 | #232 | Tragic 97.6% |
| Immigrants | Pakistan | 2.2 /100 | #233 | Tragic 97.6% |
| Colombians | 2.2 /100 | #234 | Tragic 97.6% |
| Immigrants | Malaysia | 2.1 /100 | #235 | Tragic 97.6% |
| Immigrants | Western Asia | 2.1 /100 | #236 | Tragic 97.6% |
| U.S. Virgin Islanders | 1.9 /100 | #237 | Tragic 97.6% |
| Nigerians | 1.8 /100 | #238 | Tragic 97.6% |
| Immigrants | Eastern Asia | 1.6 /100 | #239 | Tragic 97.6% |
| Koreans | 1.5 /100 | #240 | Tragic 97.6% |
| Liberians | 1.4 /100 | #241 | Tragic 97.6% |