Spaniard vs Colombian 5th Grade
COMPARE
Spaniard
Colombian
5th Grade
5th Grade Comparison
Spaniards
Colombians
97.5%
5TH GRADE
81.9/ 100
METRIC RATING
146th/ 347
METRIC RANK
96.9%
5TH GRADE
1.3/ 100
METRIC RATING
245th/ 347
METRIC RANK
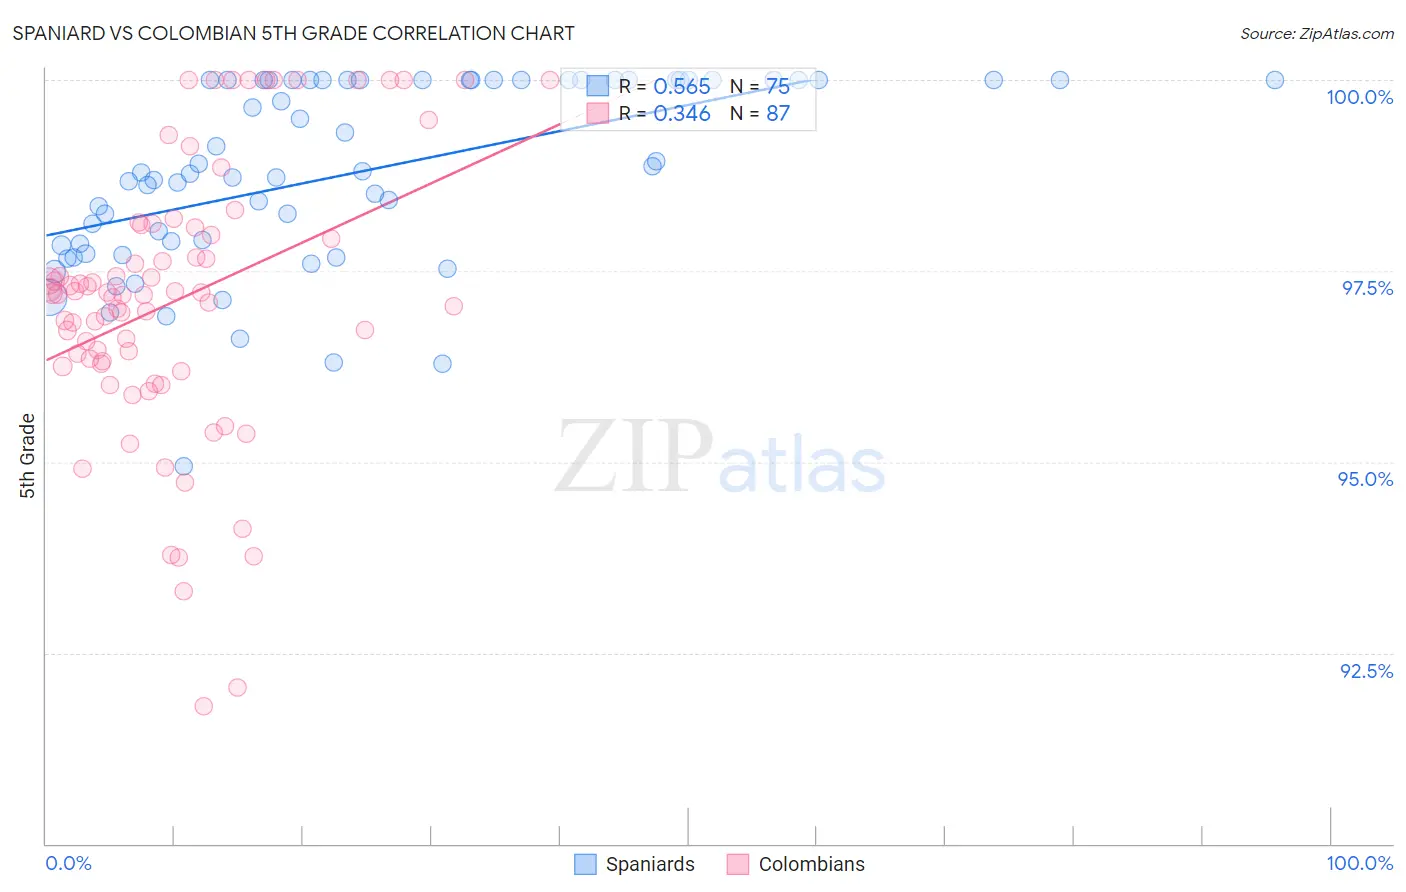
Spaniard vs Colombian 5th Grade Correlation Chart
The statistical analysis conducted on geographies consisting of 443,544,503 people shows a substantial positive correlation between the proportion of Spaniards and percentage of population with at least 5th grade education in the United States with a correlation coefficient (R) of 0.565 and weighted average of 97.5%. Similarly, the statistical analysis conducted on geographies consisting of 419,701,178 people shows a mild positive correlation between the proportion of Colombians and percentage of population with at least 5th grade education in the United States with a correlation coefficient (R) of 0.346 and weighted average of 96.9%, a difference of 0.61%.
5th Grade Correlation Summary
| Measurement | Spaniard | Colombian |
| Minimum | 94.9% | 91.8% |
| Maximum | 100.0% | 100.0% |
| Range | 5.1% | 8.2% |
| Mean | 98.8% | 97.1% |
| Median | 98.8% | 97.2% |
| Interquartile 25% (IQ1) | 97.8% | 96.3% |
| Interquartile 75% (IQ3) | 100.0% | 98.1% |
| Interquartile Range (IQR) | 2.2% | 1.8% |
| Standard Deviation (Sample) | 1.2% | 1.8% |
| Standard Deviation (Population) | 1.2% | 1.8% |
Similar Demographics by 5th Grade
Demographics Similar to Spaniards by 5th Grade
In terms of 5th grade, the demographic groups most similar to Spaniards are Jordanian (97.5%, a difference of 0.0%), Immigrants from Greece (97.5%, a difference of 0.010%), Soviet Union (97.5%, a difference of 0.010%), Immigrants from Israel (97.5%, a difference of 0.020%), and Hopi (97.5%, a difference of 0.020%).
| Demographics | Rating | Rank | 5th Grade |
| Immigrants | Turkey | 86.7 /100 | #139 | Excellent 97.5% |
| Burmese | 86.1 /100 | #140 | Excellent 97.5% |
| Seminole | 85.8 /100 | #141 | Excellent 97.5% |
| Israelis | 85.5 /100 | #142 | Excellent 97.5% |
| Immigrants | North Macedonia | 85.4 /100 | #143 | Excellent 97.5% |
| Immigrants | Greece | 83.2 /100 | #144 | Excellent 97.5% |
| Jordanians | 82.6 /100 | #145 | Excellent 97.5% |
| Spaniards | 81.9 /100 | #146 | Excellent 97.5% |
| Soviet Union | 81.2 /100 | #147 | Excellent 97.5% |
| Immigrants | Israel | 79.1 /100 | #148 | Good 97.5% |
| Hopi | 78.6 /100 | #149 | Good 97.5% |
| Immigrants | South Central Asia | 78.6 /100 | #150 | Good 97.5% |
| Immigrants | Eastern Europe | 75.0 /100 | #151 | Good 97.4% |
| Ute | 74.9 /100 | #152 | Good 97.4% |
| Alsatians | 74.3 /100 | #153 | Good 97.4% |
Demographics Similar to Colombians by 5th Grade
In terms of 5th grade, the demographic groups most similar to Colombians are Ethiopian (96.9%, a difference of 0.010%), Immigrants from Asia (96.9%, a difference of 0.020%), Immigrants from Costa Rica (96.9%, a difference of 0.020%), Immigrants from Eastern Africa (96.9%, a difference of 0.020%), and Korean (96.9%, a difference of 0.020%).
| Demographics | Rating | Rank | 5th Grade |
| Asians | 2.0 /100 | #238 | Tragic 96.9% |
| Nigerians | 1.9 /100 | #239 | Tragic 96.9% |
| Indians (Asian) | 1.9 /100 | #240 | Tragic 96.9% |
| Immigrants | Asia | 1.7 /100 | #241 | Tragic 96.9% |
| Immigrants | Costa Rica | 1.6 /100 | #242 | Tragic 96.9% |
| Immigrants | Eastern Africa | 1.6 /100 | #243 | Tragic 96.9% |
| Koreans | 1.6 /100 | #244 | Tragic 96.9% |
| Colombians | 1.3 /100 | #245 | Tragic 96.9% |
| Ethiopians | 1.2 /100 | #246 | Tragic 96.9% |
| Immigrants | Africa | 1.1 /100 | #247 | Tragic 96.9% |
| U.S. Virgin Islanders | 1.1 /100 | #248 | Tragic 96.9% |
| Immigrants | Uruguay | 1.0 /100 | #249 | Tragic 96.9% |
| Immigrants | Liberia | 1.0 /100 | #250 | Tragic 96.9% |
| Bolivians | 0.9 /100 | #251 | Tragic 96.9% |
| Jamaicans | 0.9 /100 | #252 | Tragic 96.9% |