Spaniard vs Bhutanese 1 or more Vehicles in Household
COMPARE
Spaniard
Bhutanese
1 or more Vehicles in Household
1 or more Vehicles in Household Comparison
Spaniards
Bhutanese
91.8%
1 OR MORE VEHICLES IN HOUSEHOLD
99.8/ 100
METRIC RATING
67th/ 347
METRIC RANK
91.4%
1 OR MORE VEHICLES IN HOUSEHOLD
99.2/ 100
METRIC RATING
92nd/ 347
METRIC RANK
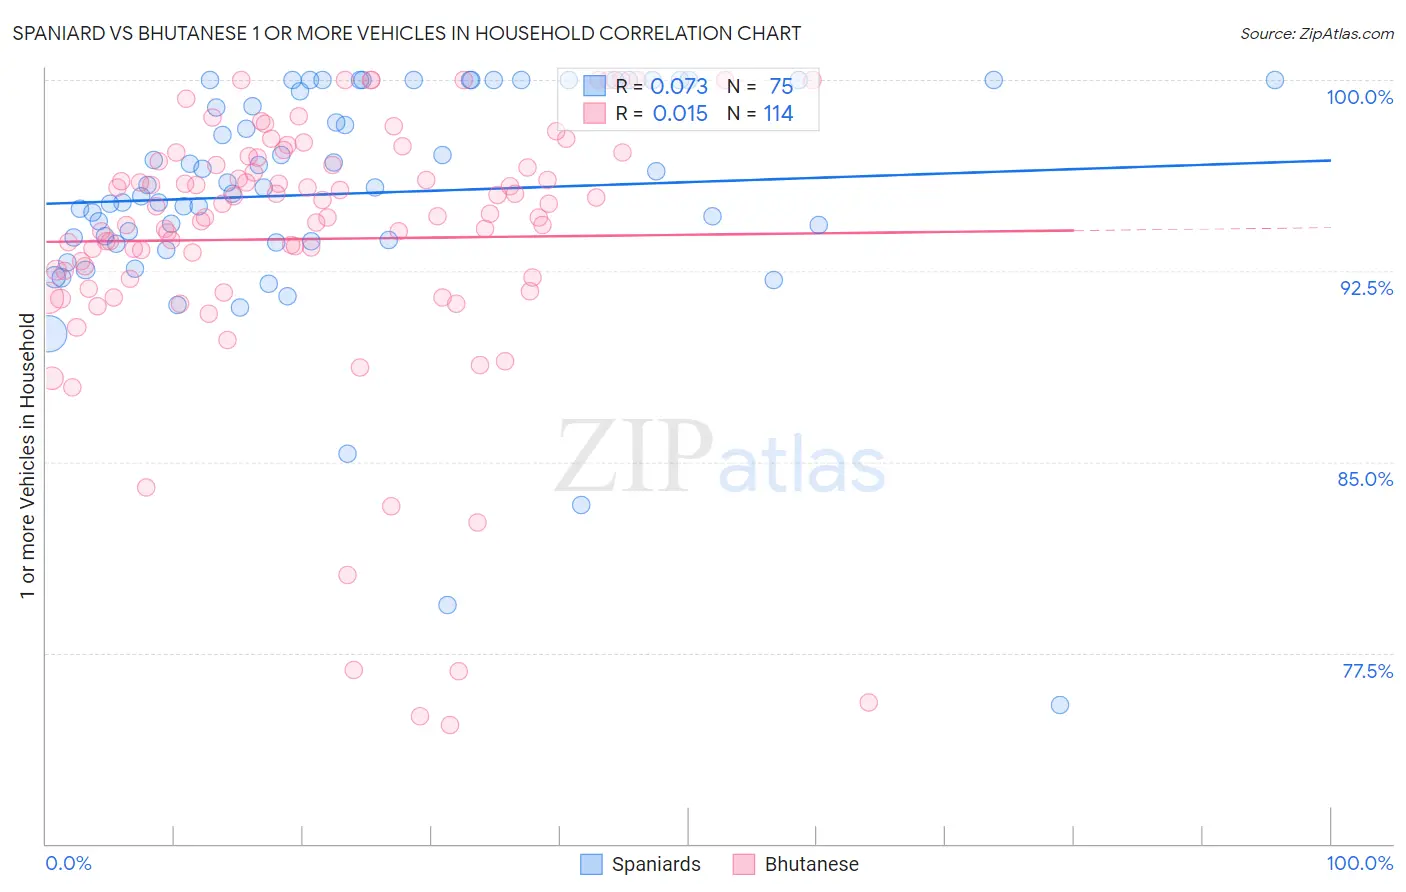
Spaniard vs Bhutanese 1 or more Vehicles in Household Correlation Chart
The statistical analysis conducted on geographies consisting of 443,238,522 people shows a slight positive correlation between the proportion of Spaniards and percentage of households with 1 or more vehicles available in the United States with a correlation coefficient (R) of 0.073 and weighted average of 91.8%. Similarly, the statistical analysis conducted on geographies consisting of 455,231,093 people shows no correlation between the proportion of Bhutanese and percentage of households with 1 or more vehicles available in the United States with a correlation coefficient (R) of 0.015 and weighted average of 91.4%, a difference of 0.45%.
1 or more Vehicles in Household Correlation Summary
| Measurement | Spaniard | Bhutanese |
| Minimum | 75.5% | 74.7% |
| Maximum | 100.0% | 100.0% |
| Range | 24.5% | 25.3% |
| Mean | 95.5% | 93.8% |
| Median | 95.8% | 94.7% |
| Interquartile 25% (IQ1) | 93.7% | 92.2% |
| Interquartile 75% (IQ3) | 100.0% | 96.8% |
| Interquartile Range (IQR) | 6.3% | 4.6% |
| Standard Deviation (Sample) | 4.6% | 5.3% |
| Standard Deviation (Population) | 4.6% | 5.3% |
Similar Demographics by 1 or more Vehicles in Household
Demographics Similar to Spaniards by 1 or more Vehicles in Household
In terms of 1 or more vehicles in household, the demographic groups most similar to Spaniards are Canadian (91.8%, a difference of 0.020%), Immigrants from Scotland (91.8%, a difference of 0.030%), Immigrants from Laos (91.8%, a difference of 0.040%), Croatian (91.9%, a difference of 0.070%), and Palestinian (91.7%, a difference of 0.070%).
| Demographics | Rating | Rank | 1 or more Vehicles in Household |
| Slovaks | 99.8 /100 | #60 | Exceptional 91.9% |
| Immigrants | India | 99.8 /100 | #61 | Exceptional 91.9% |
| Thais | 99.8 /100 | #62 | Exceptional 91.9% |
| Chinese | 99.8 /100 | #63 | Exceptional 91.9% |
| Croatians | 99.8 /100 | #64 | Exceptional 91.9% |
| Immigrants | Laos | 99.8 /100 | #65 | Exceptional 91.8% |
| Canadians | 99.8 /100 | #66 | Exceptional 91.8% |
| Spaniards | 99.8 /100 | #67 | Exceptional 91.8% |
| Immigrants | Scotland | 99.7 /100 | #68 | Exceptional 91.8% |
| Palestinians | 99.7 /100 | #69 | Exceptional 91.7% |
| Lithuanians | 99.7 /100 | #70 | Exceptional 91.7% |
| Poles | 99.7 /100 | #71 | Exceptional 91.7% |
| Cajuns | 99.7 /100 | #72 | Exceptional 91.7% |
| Immigrants | Iran | 99.7 /100 | #73 | Exceptional 91.7% |
| Immigrants | Lebanon | 99.6 /100 | #74 | Exceptional 91.6% |
Demographics Similar to Bhutanese by 1 or more Vehicles in Household
In terms of 1 or more vehicles in household, the demographic groups most similar to Bhutanese are Immigrants from North America (91.4%, a difference of 0.0%), Immigrants from Germany (91.4%, a difference of 0.010%), Spanish American (91.4%, a difference of 0.010%), Bangladeshi (91.4%, a difference of 0.010%), and Immigrants from Canada (91.4%, a difference of 0.010%).
| Demographics | Rating | Rank | 1 or more Vehicles in Household |
| Tsimshian | 99.3 /100 | #85 | Exceptional 91.4% |
| Osage | 99.2 /100 | #86 | Exceptional 91.4% |
| Immigrants | Germany | 99.2 /100 | #87 | Exceptional 91.4% |
| Spanish Americans | 99.2 /100 | #88 | Exceptional 91.4% |
| Bangladeshis | 99.2 /100 | #89 | Exceptional 91.4% |
| Immigrants | Canada | 99.2 /100 | #90 | Exceptional 91.4% |
| Immigrants | Jordan | 99.2 /100 | #91 | Exceptional 91.4% |
| Bhutanese | 99.2 /100 | #92 | Exceptional 91.4% |
| Immigrants | North America | 99.2 /100 | #93 | Exceptional 91.4% |
| Immigrants | Cuba | 99.1 /100 | #94 | Exceptional 91.3% |
| Austrians | 99.0 /100 | #95 | Exceptional 91.3% |
| Potawatomi | 99.0 /100 | #96 | Exceptional 91.3% |
| Pakistanis | 99.0 /100 | #97 | Exceptional 91.3% |
| Slavs | 98.7 /100 | #98 | Exceptional 91.2% |
| Immigrants | Bolivia | 98.6 /100 | #99 | Exceptional 91.2% |