Spaniard vs Italian 1 or more Vehicles in Household
COMPARE
Spaniard
Italian
1 or more Vehicles in Household
1 or more Vehicles in Household Comparison
Spaniards
Italians
91.8%
1 OR MORE VEHICLES IN HOUSEHOLD
99.8/ 100
METRIC RATING
67th/ 347
METRIC RANK
92.3%
1 OR MORE VEHICLES IN HOUSEHOLD
99.9/ 100
METRIC RATING
34th/ 347
METRIC RANK
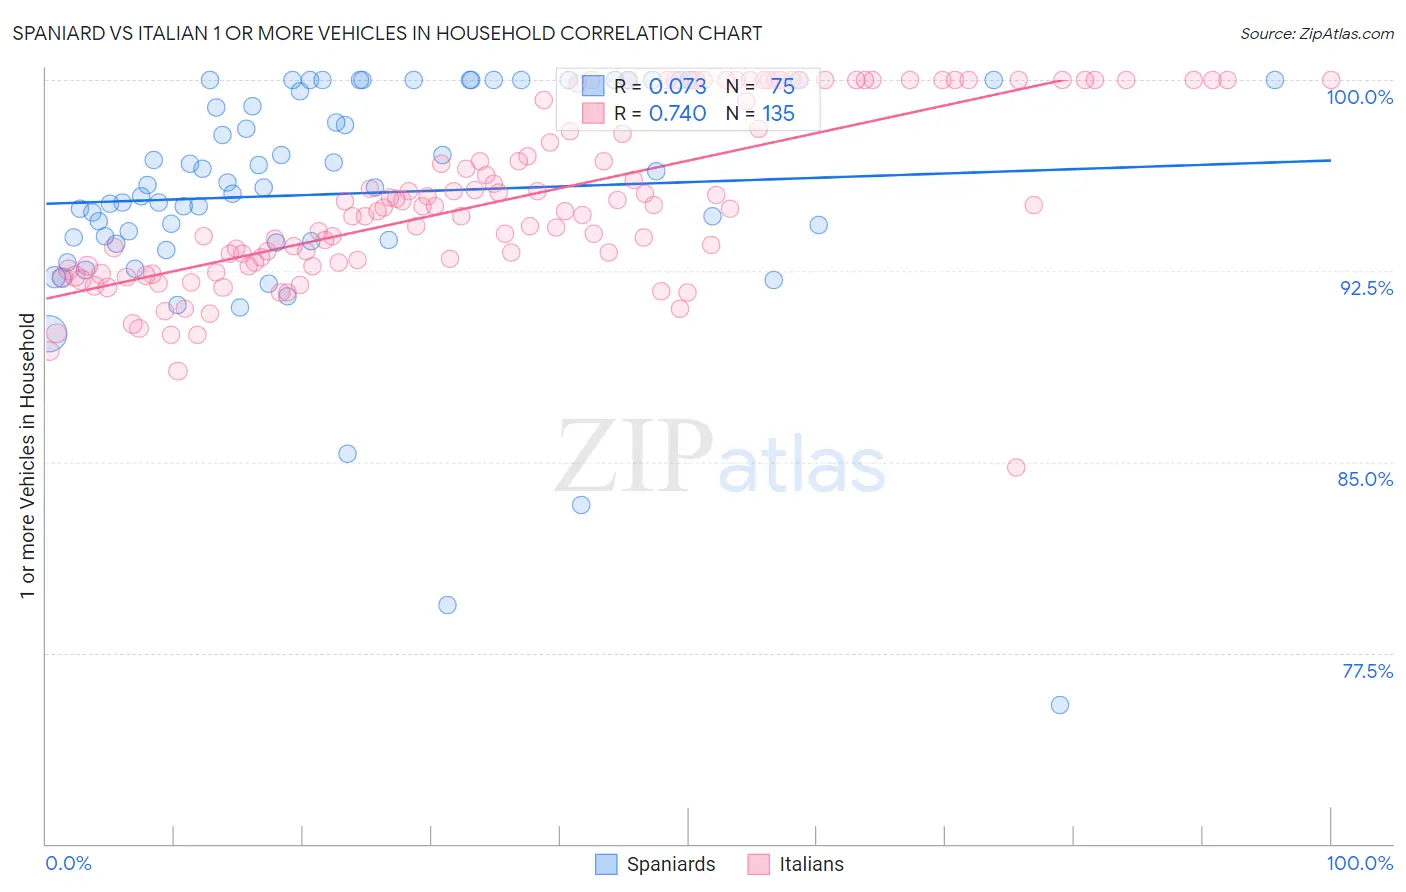
Spaniard vs Italian 1 or more Vehicles in Household Correlation Chart
The statistical analysis conducted on geographies consisting of 443,238,522 people shows a slight positive correlation between the proportion of Spaniards and percentage of households with 1 or more vehicles available in the United States with a correlation coefficient (R) of 0.073 and weighted average of 91.8%. Similarly, the statistical analysis conducted on geographies consisting of 548,442,279 people shows a strong positive correlation between the proportion of Italians and percentage of households with 1 or more vehicles available in the United States with a correlation coefficient (R) of 0.740 and weighted average of 92.3%, a difference of 0.59%.
1 or more Vehicles in Household Correlation Summary
| Measurement | Spaniard | Italian |
| Minimum | 75.5% | 84.8% |
| Maximum | 100.0% | 100.0% |
| Range | 24.5% | 15.2% |
| Mean | 95.5% | 95.3% |
| Median | 95.8% | 95.0% |
| Interquartile 25% (IQ1) | 93.7% | 92.7% |
| Interquartile 75% (IQ3) | 100.0% | 99.9% |
| Interquartile Range (IQR) | 6.3% | 7.2% |
| Standard Deviation (Sample) | 4.6% | 3.4% |
| Standard Deviation (Population) | 4.6% | 3.4% |
Similar Demographics by 1 or more Vehicles in Household
Demographics Similar to Spaniards by 1 or more Vehicles in Household
In terms of 1 or more vehicles in household, the demographic groups most similar to Spaniards are Canadian (91.8%, a difference of 0.020%), Immigrants from Scotland (91.8%, a difference of 0.030%), Immigrants from Laos (91.8%, a difference of 0.040%), Croatian (91.9%, a difference of 0.070%), and Palestinian (91.7%, a difference of 0.070%).
| Demographics | Rating | Rank | 1 or more Vehicles in Household |
| Slovaks | 99.8 /100 | #60 | Exceptional 91.9% |
| Immigrants | India | 99.8 /100 | #61 | Exceptional 91.9% |
| Thais | 99.8 /100 | #62 | Exceptional 91.9% |
| Chinese | 99.8 /100 | #63 | Exceptional 91.9% |
| Croatians | 99.8 /100 | #64 | Exceptional 91.9% |
| Immigrants | Laos | 99.8 /100 | #65 | Exceptional 91.8% |
| Canadians | 99.8 /100 | #66 | Exceptional 91.8% |
| Spaniards | 99.8 /100 | #67 | Exceptional 91.8% |
| Immigrants | Scotland | 99.7 /100 | #68 | Exceptional 91.8% |
| Palestinians | 99.7 /100 | #69 | Exceptional 91.7% |
| Lithuanians | 99.7 /100 | #70 | Exceptional 91.7% |
| Poles | 99.7 /100 | #71 | Exceptional 91.7% |
| Cajuns | 99.7 /100 | #72 | Exceptional 91.7% |
| Immigrants | Iran | 99.7 /100 | #73 | Exceptional 91.7% |
| Immigrants | Lebanon | 99.6 /100 | #74 | Exceptional 91.6% |
Demographics Similar to Italians by 1 or more Vehicles in Household
In terms of 1 or more vehicles in household, the demographic groups most similar to Italians are Czechoslovakian (92.3%, a difference of 0.010%), Malaysian (92.3%, a difference of 0.010%), French Canadian (92.3%, a difference of 0.020%), Immigrants from Vietnam (92.3%, a difference of 0.020%), and Swiss (92.3%, a difference of 0.030%).
| Demographics | Rating | Rank | 1 or more Vehicles in Household |
| Americans | 100.0 /100 | #27 | Exceptional 92.5% |
| Sri Lankans | 100.0 /100 | #28 | Exceptional 92.5% |
| Native Hawaiians | 100.0 /100 | #29 | Exceptional 92.4% |
| Finns | 100.0 /100 | #30 | Exceptional 92.4% |
| Samoans | 100.0 /100 | #31 | Exceptional 92.4% |
| Basques | 100.0 /100 | #32 | Exceptional 92.4% |
| Cherokee | 100.0 /100 | #33 | Exceptional 92.4% |
| Italians | 99.9 /100 | #34 | Exceptional 92.3% |
| Czechoslovakians | 99.9 /100 | #35 | Exceptional 92.3% |
| Malaysians | 99.9 /100 | #36 | Exceptional 92.3% |
| French Canadians | 99.9 /100 | #37 | Exceptional 92.3% |
| Immigrants | Vietnam | 99.9 /100 | #38 | Exceptional 92.3% |
| Swiss | 99.9 /100 | #39 | Exceptional 92.3% |
| Creek | 99.9 /100 | #40 | Exceptional 92.3% |
| Immigrants | Taiwan | 99.9 /100 | #41 | Exceptional 92.3% |