Soviet Union vs Immigrants from South America 4 or more Vehicles in Household
COMPARE
Soviet Union
Immigrants from South America
4 or more Vehicles in Household
4 or more Vehicles in Household Comparison
Soviet Union
Immigrants from South America
4.4%
4 OR MORE VEHICLES IN HOUSEHOLD
0.0/ 100
METRIC RATING
324th/ 347
METRIC RANK
5.2%
4 OR MORE VEHICLES IN HOUSEHOLD
0.1/ 100
METRIC RATING
298th/ 347
METRIC RANK
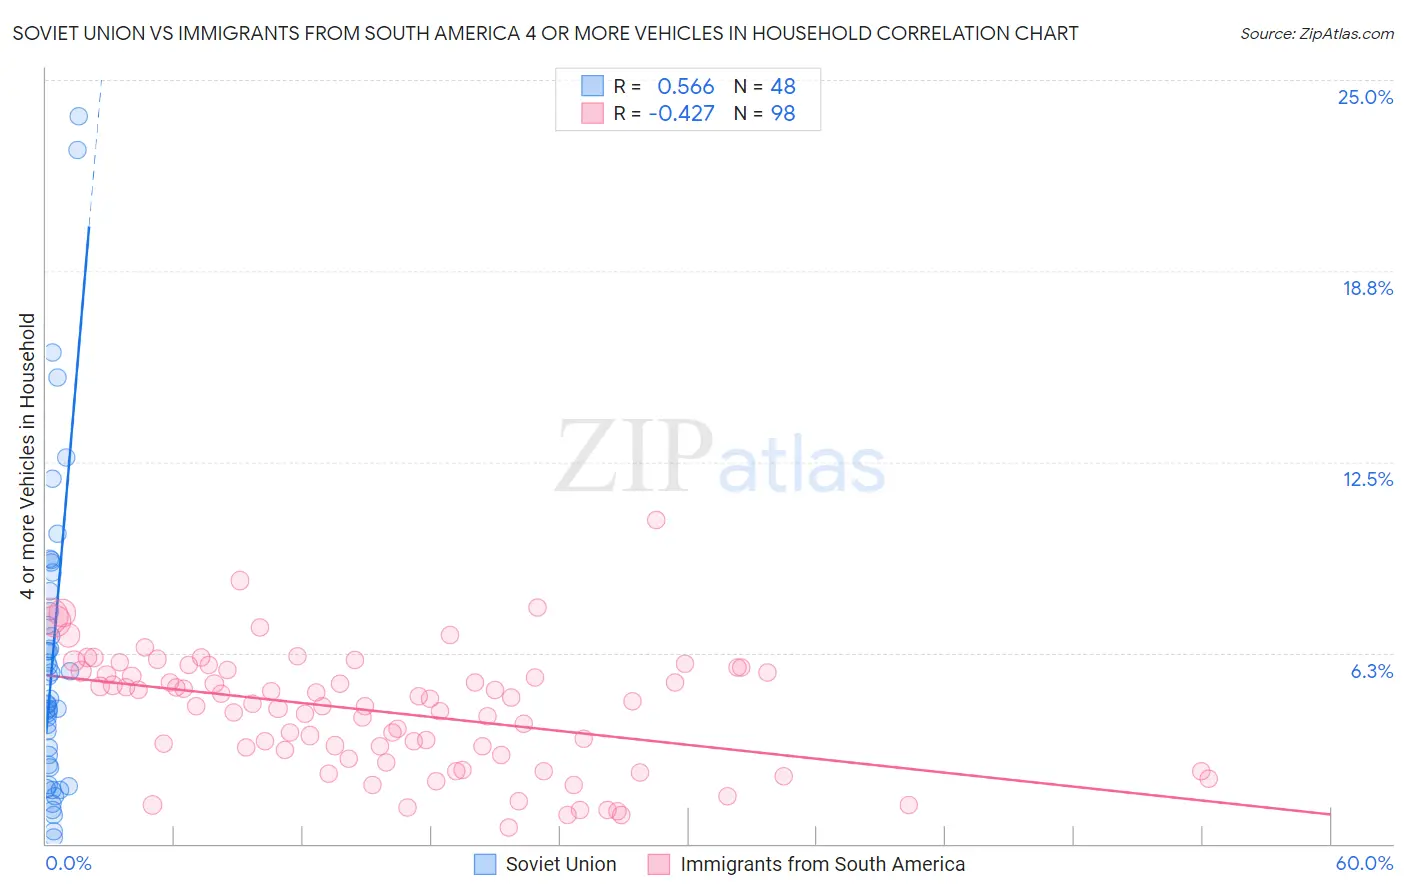
Soviet Union vs Immigrants from South America 4 or more Vehicles in Household Correlation Chart
The statistical analysis conducted on geographies consisting of 43,372,100 people shows a substantial positive correlation between the proportion of Soviet Union and percentage of households with 4 or more vehicles available in the United States with a correlation coefficient (R) of 0.566 and weighted average of 4.4%. Similarly, the statistical analysis conducted on geographies consisting of 483,870,407 people shows a moderate negative correlation between the proportion of Immigrants from South America and percentage of households with 4 or more vehicles available in the United States with a correlation coefficient (R) of -0.427 and weighted average of 5.2%, a difference of 17.4%.
4 or more Vehicles in Household Correlation Summary
| Measurement | Soviet Union | Immigrants from South America |
| Minimum | 0.22% | 0.55% |
| Maximum | 23.8% | 10.6% |
| Range | 23.6% | 10.1% |
| Mean | 6.2% | 4.3% |
| Median | 4.7% | 4.5% |
| Interquartile 25% (IQ1) | 2.6% | 2.9% |
| Interquartile 75% (IQ3) | 7.9% | 5.6% |
| Interquartile Range (IQR) | 5.4% | 2.7% |
| Standard Deviation (Sample) | 5.1% | 1.9% |
| Standard Deviation (Population) | 5.1% | 1.9% |
Similar Demographics by 4 or more Vehicles in Household
Demographics Similar to Soviet Union by 4 or more Vehicles in Household
In terms of 4 or more vehicles in household, the demographic groups most similar to Soviet Union are Immigrants from Caribbean (4.4%, a difference of 0.28%), Immigrants from Jamaica (4.4%, a difference of 0.32%), Cape Verdean (4.4%, a difference of 0.64%), Immigrants from Yemen (4.5%, a difference of 0.69%), and Ecuadorian (4.5%, a difference of 0.86%).
| Demographics | Rating | Rank | 4 or more Vehicles in Household |
| U.S. Virgin Islanders | 0.0 /100 | #317 | Tragic 4.6% |
| Jamaicans | 0.0 /100 | #318 | Tragic 4.6% |
| Haitians | 0.0 /100 | #319 | Tragic 4.6% |
| Immigrants | Haiti | 0.0 /100 | #320 | Tragic 4.5% |
| Ecuadorians | 0.0 /100 | #321 | Tragic 4.5% |
| Immigrants | Yemen | 0.0 /100 | #322 | Tragic 4.5% |
| Immigrants | Caribbean | 0.0 /100 | #323 | Tragic 4.4% |
| Soviet Union | 0.0 /100 | #324 | Tragic 4.4% |
| Immigrants | Jamaica | 0.0 /100 | #325 | Tragic 4.4% |
| Cape Verdeans | 0.0 /100 | #326 | Tragic 4.4% |
| Senegalese | 0.0 /100 | #327 | Tragic 4.3% |
| Trinidadians and Tobagonians | 0.0 /100 | #328 | Tragic 4.3% |
| Immigrants | Senegal | 0.0 /100 | #329 | Tragic 4.2% |
| Immigrants | Ecuador | 0.0 /100 | #330 | Tragic 4.2% |
| West Indians | 0.0 /100 | #331 | Tragic 4.2% |
Demographics Similar to Immigrants from South America by 4 or more Vehicles in Household
In terms of 4 or more vehicles in household, the demographic groups most similar to Immigrants from South America are Immigrants from Venezuela (5.2%, a difference of 0.34%), Immigrants from Ghana (5.2%, a difference of 0.46%), Israeli (5.2%, a difference of 0.63%), Immigrants from Brazil (5.2%, a difference of 0.81%), and Ghanaian (5.2%, a difference of 0.92%).
| Demographics | Rating | Rank | 4 or more Vehicles in Household |
| Immigrants | Bahamas | 0.1 /100 | #291 | Tragic 5.3% |
| Liberians | 0.1 /100 | #292 | Tragic 5.3% |
| Immigrants | Congo | 0.1 /100 | #293 | Tragic 5.2% |
| Ghanaians | 0.1 /100 | #294 | Tragic 5.2% |
| Immigrants | Brazil | 0.1 /100 | #295 | Tragic 5.2% |
| Israelis | 0.1 /100 | #296 | Tragic 5.2% |
| Immigrants | Venezuela | 0.1 /100 | #297 | Tragic 5.2% |
| Immigrants | South America | 0.1 /100 | #298 | Tragic 5.2% |
| Immigrants | Ghana | 0.1 /100 | #299 | Tragic 5.2% |
| Immigrants | Morocco | 0.0 /100 | #300 | Tragic 5.1% |
| Immigrants | Zaire | 0.0 /100 | #301 | Tragic 5.1% |
| Bahamians | 0.0 /100 | #302 | Tragic 5.1% |
| Immigrants | Greece | 0.0 /100 | #303 | Tragic 5.1% |
| Cypriots | 0.0 /100 | #304 | Tragic 5.0% |
| Somalis | 0.0 /100 | #305 | Tragic 5.0% |