Slavic vs U.S. Virgin Islander 2 or more Vehicles in Household
COMPARE
Slavic
U.S. Virgin Islander
2 or more Vehicles in Household
2 or more Vehicles in Household Comparison
Slavs
U.S. Virgin Islanders
57.8%
2 OR MORE VEHICLES IN HOUSEHOLD
98.8/ 100
METRIC RATING
97th/ 347
METRIC RANK
47.5%
2 OR MORE VEHICLES IN HOUSEHOLD
0.0/ 100
METRIC RATING
313th/ 347
METRIC RANK
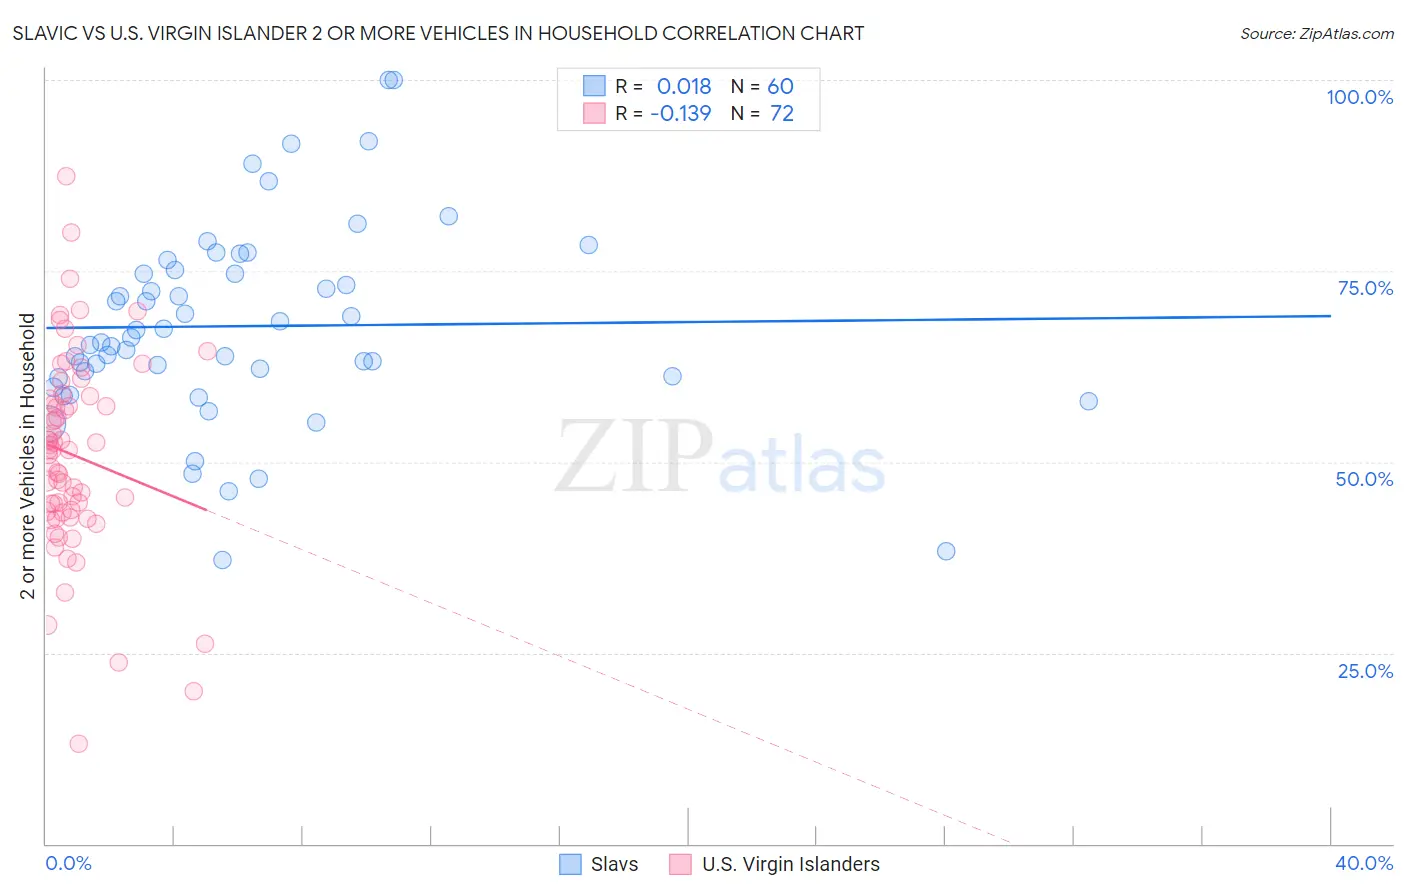
Slavic vs U.S. Virgin Islander 2 or more Vehicles in Household Correlation Chart
The statistical analysis conducted on geographies consisting of 270,821,936 people shows no correlation between the proportion of Slavs and percentage of households with 2 or more vehicles available in the United States with a correlation coefficient (R) of 0.018 and weighted average of 57.8%. Similarly, the statistical analysis conducted on geographies consisting of 87,429,921 people shows a poor negative correlation between the proportion of U.S. Virgin Islanders and percentage of households with 2 or more vehicles available in the United States with a correlation coefficient (R) of -0.139 and weighted average of 47.5%, a difference of 21.7%.
2 or more Vehicles in Household Correlation Summary
| Measurement | Slavic | U.S. Virgin Islander |
| Minimum | 37.2% | 13.1% |
| Maximum | 100.0% | 87.3% |
| Range | 62.8% | 74.2% |
| Mean | 67.8% | 50.9% |
| Median | 66.0% | 51.5% |
| Interquartile 25% (IQ1) | 61.1% | 43.4% |
| Interquartile 75% (IQ3) | 74.9% | 58.4% |
| Interquartile Range (IQR) | 13.7% | 14.9% |
| Standard Deviation (Sample) | 12.9% | 13.1% |
| Standard Deviation (Population) | 12.8% | 13.0% |
Similar Demographics by 2 or more Vehicles in Household
Demographics Similar to Slavs by 2 or more Vehicles in Household
In terms of 2 or more vehicles in household, the demographic groups most similar to Slavs are Burmese (57.8%, a difference of 0.020%), Hmong (57.8%, a difference of 0.060%), Filipino (57.8%, a difference of 0.080%), Ottawa (57.9%, a difference of 0.14%), and Shoshone (57.9%, a difference of 0.15%).
| Demographics | Rating | Rank | 2 or more Vehicles in Household |
| Hispanics or Latinos | 99.0 /100 | #90 | Exceptional 57.9% |
| Pakistanis | 99.0 /100 | #91 | Exceptional 57.9% |
| Shoshone | 99.0 /100 | #92 | Exceptional 57.9% |
| Ottawa | 99.0 /100 | #93 | Exceptional 57.9% |
| Filipinos | 98.9 /100 | #94 | Exceptional 57.8% |
| Hmong | 98.9 /100 | #95 | Exceptional 57.8% |
| Burmese | 98.8 /100 | #96 | Exceptional 57.8% |
| Slavs | 98.8 /100 | #97 | Exceptional 57.8% |
| Palestinians | 98.6 /100 | #98 | Exceptional 57.7% |
| Cajuns | 98.5 /100 | #99 | Exceptional 57.7% |
| Fijians | 98.4 /100 | #100 | Exceptional 57.6% |
| Lebanese | 98.3 /100 | #101 | Exceptional 57.6% |
| Immigrants | Bolivia | 98.2 /100 | #102 | Exceptional 57.6% |
| Jordanians | 98.2 /100 | #103 | Exceptional 57.6% |
| Immigrants | Indonesia | 98.2 /100 | #104 | Exceptional 57.6% |
Demographics Similar to U.S. Virgin Islanders by 2 or more Vehicles in Household
In terms of 2 or more vehicles in household, the demographic groups most similar to U.S. Virgin Islanders are Haitian (47.6%, a difference of 0.17%), Immigrants from Ghana (47.4%, a difference of 0.22%), Puerto Rican (47.1%, a difference of 0.80%), Immigrants from Belarus (47.9%, a difference of 0.91%), and Ghanaian (48.0%, a difference of 1.0%).
| Demographics | Rating | Rank | 2 or more Vehicles in Household |
| Immigrants | Israel | 0.0 /100 | #306 | Tragic 49.2% |
| Hopi | 0.0 /100 | #307 | Tragic 49.0% |
| Albanians | 0.0 /100 | #308 | Tragic 49.0% |
| Moroccans | 0.0 /100 | #309 | Tragic 48.8% |
| Ghanaians | 0.0 /100 | #310 | Tragic 48.0% |
| Immigrants | Belarus | 0.0 /100 | #311 | Tragic 47.9% |
| Haitians | 0.0 /100 | #312 | Tragic 47.6% |
| U.S. Virgin Islanders | 0.0 /100 | #313 | Tragic 47.5% |
| Immigrants | Ghana | 0.0 /100 | #314 | Tragic 47.4% |
| Puerto Ricans | 0.0 /100 | #315 | Tragic 47.1% |
| Cape Verdeans | 0.0 /100 | #316 | Tragic 46.8% |
| Immigrants | Haiti | 0.0 /100 | #317 | Tragic 46.5% |
| Immigrants | Albania | 0.0 /100 | #318 | Tragic 46.0% |
| Jamaicans | 0.0 /100 | #319 | Tragic 45.8% |
| Soviet Union | 0.0 /100 | #320 | Tragic 45.7% |