Slavic vs Immigrants from Western Africa 2 or more Vehicles in Household
COMPARE
Slavic
Immigrants from Western Africa
2 or more Vehicles in Household
2 or more Vehicles in Household Comparison
Slavs
Immigrants from Western Africa
57.8%
2 OR MORE VEHICLES IN HOUSEHOLD
98.8/ 100
METRIC RATING
97th/ 347
METRIC RANK
49.4%
2 OR MORE VEHICLES IN HOUSEHOLD
0.0/ 100
METRIC RATING
305th/ 347
METRIC RANK
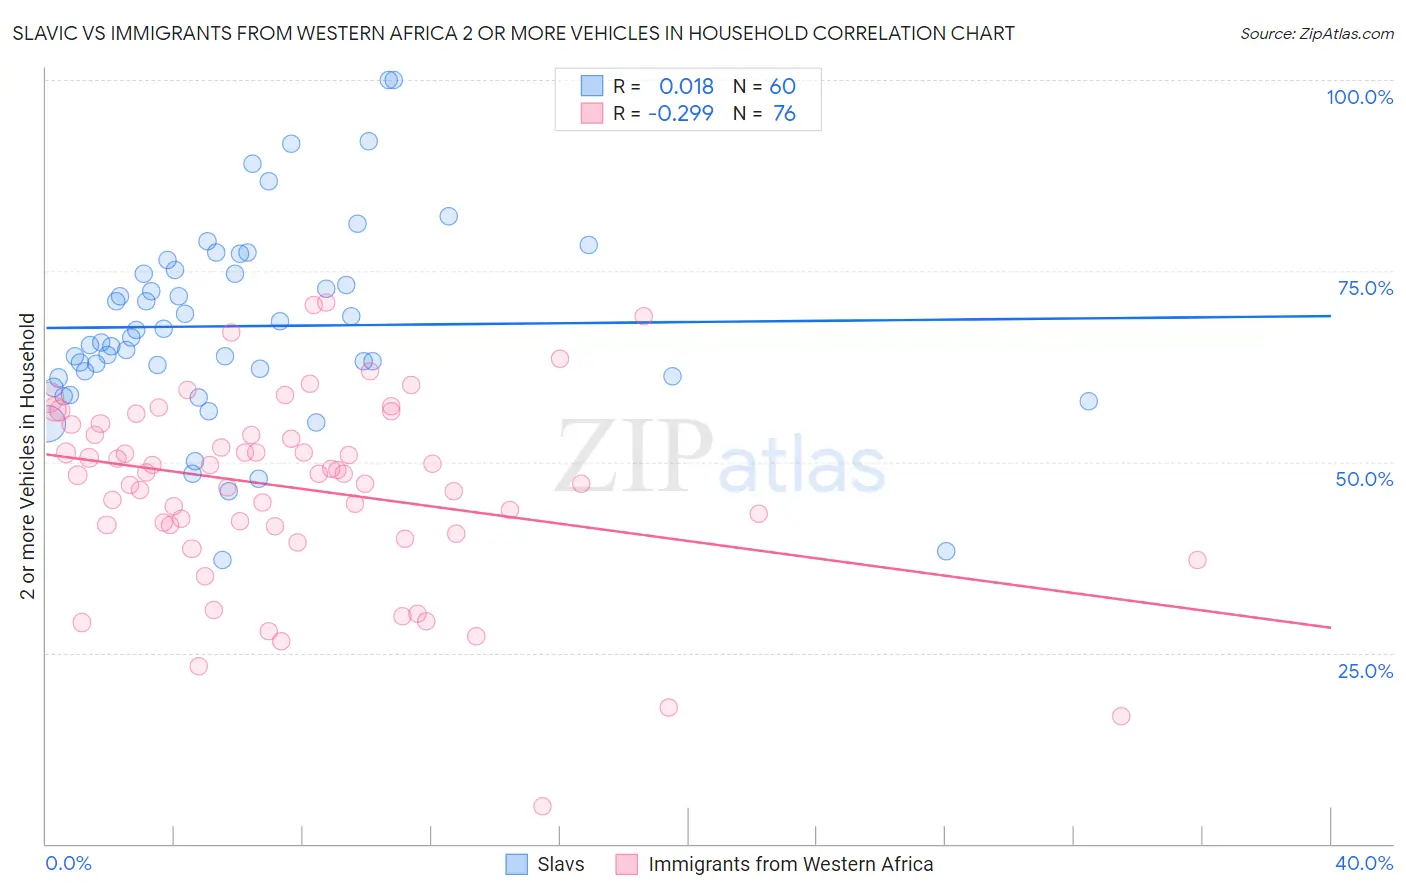
Slavic vs Immigrants from Western Africa 2 or more Vehicles in Household Correlation Chart
The statistical analysis conducted on geographies consisting of 270,821,936 people shows no correlation between the proportion of Slavs and percentage of households with 2 or more vehicles available in the United States with a correlation coefficient (R) of 0.018 and weighted average of 57.8%. Similarly, the statistical analysis conducted on geographies consisting of 357,581,747 people shows a weak negative correlation between the proportion of Immigrants from Western Africa and percentage of households with 2 or more vehicles available in the United States with a correlation coefficient (R) of -0.299 and weighted average of 49.4%, a difference of 17.1%.
2 or more Vehicles in Household Correlation Summary
| Measurement | Slavic | Immigrants from Western Africa |
| Minimum | 37.2% | 4.9% |
| Maximum | 100.0% | 70.9% |
| Range | 62.8% | 66.0% |
| Mean | 67.8% | 46.5% |
| Median | 66.0% | 48.5% |
| Interquartile 25% (IQ1) | 61.1% | 41.6% |
| Interquartile 75% (IQ3) | 74.9% | 54.2% |
| Interquartile Range (IQR) | 13.7% | 12.6% |
| Standard Deviation (Sample) | 12.9% | 12.5% |
| Standard Deviation (Population) | 12.8% | 12.4% |
Similar Demographics by 2 or more Vehicles in Household
Demographics Similar to Slavs by 2 or more Vehicles in Household
In terms of 2 or more vehicles in household, the demographic groups most similar to Slavs are Burmese (57.8%, a difference of 0.020%), Hmong (57.8%, a difference of 0.060%), Filipino (57.8%, a difference of 0.080%), Ottawa (57.9%, a difference of 0.14%), and Shoshone (57.9%, a difference of 0.15%).
| Demographics | Rating | Rank | 2 or more Vehicles in Household |
| Hispanics or Latinos | 99.0 /100 | #90 | Exceptional 57.9% |
| Pakistanis | 99.0 /100 | #91 | Exceptional 57.9% |
| Shoshone | 99.0 /100 | #92 | Exceptional 57.9% |
| Ottawa | 99.0 /100 | #93 | Exceptional 57.9% |
| Filipinos | 98.9 /100 | #94 | Exceptional 57.8% |
| Hmong | 98.9 /100 | #95 | Exceptional 57.8% |
| Burmese | 98.8 /100 | #96 | Exceptional 57.8% |
| Slavs | 98.8 /100 | #97 | Exceptional 57.8% |
| Palestinians | 98.6 /100 | #98 | Exceptional 57.7% |
| Cajuns | 98.5 /100 | #99 | Exceptional 57.7% |
| Fijians | 98.4 /100 | #100 | Exceptional 57.6% |
| Lebanese | 98.3 /100 | #101 | Exceptional 57.6% |
| Immigrants | Bolivia | 98.2 /100 | #102 | Exceptional 57.6% |
| Jordanians | 98.2 /100 | #103 | Exceptional 57.6% |
| Immigrants | Indonesia | 98.2 /100 | #104 | Exceptional 57.6% |
Demographics Similar to Immigrants from Western Africa by 2 or more Vehicles in Household
In terms of 2 or more vehicles in household, the demographic groups most similar to Immigrants from Western Africa are Immigrants from Israel (49.2%, a difference of 0.26%), Hopi (49.0%, a difference of 0.69%), Albanian (49.0%, a difference of 0.76%), Immigrants from Belize (49.9%, a difference of 1.1%), and Moroccan (48.8%, a difference of 1.1%).
| Demographics | Rating | Rank | 2 or more Vehicles in Household |
| Paraguayans | 0.0 /100 | #298 | Tragic 50.3% |
| Immigrants | Morocco | 0.0 /100 | #299 | Tragic 50.3% |
| Immigrants | Russia | 0.0 /100 | #300 | Tragic 50.3% |
| Immigrants | Greece | 0.0 /100 | #301 | Tragic 50.2% |
| Immigrants | South America | 0.0 /100 | #302 | Tragic 50.2% |
| Tohono O'odham | 0.0 /100 | #303 | Tragic 50.0% |
| Immigrants | Belize | 0.0 /100 | #304 | Tragic 49.9% |
| Immigrants | Western Africa | 0.0 /100 | #305 | Tragic 49.4% |
| Immigrants | Israel | 0.0 /100 | #306 | Tragic 49.2% |
| Hopi | 0.0 /100 | #307 | Tragic 49.0% |
| Albanians | 0.0 /100 | #308 | Tragic 49.0% |
| Moroccans | 0.0 /100 | #309 | Tragic 48.8% |
| Ghanaians | 0.0 /100 | #310 | Tragic 48.0% |
| Immigrants | Belarus | 0.0 /100 | #311 | Tragic 47.9% |
| Haitians | 0.0 /100 | #312 | Tragic 47.6% |