Slavic vs U.S. Virgin Islander Female Unemployment
COMPARE
Slavic
U.S. Virgin Islander
Female Unemployment
Female Unemployment Comparison
Slavs
U.S. Virgin Islanders
4.9%
FEMALE UNEMPLOYMENT
99.1/ 100
METRIC RATING
52nd/ 347
METRIC RANK
6.2%
FEMALE UNEMPLOYMENT
0.0/ 100
METRIC RATING
302nd/ 347
METRIC RANK
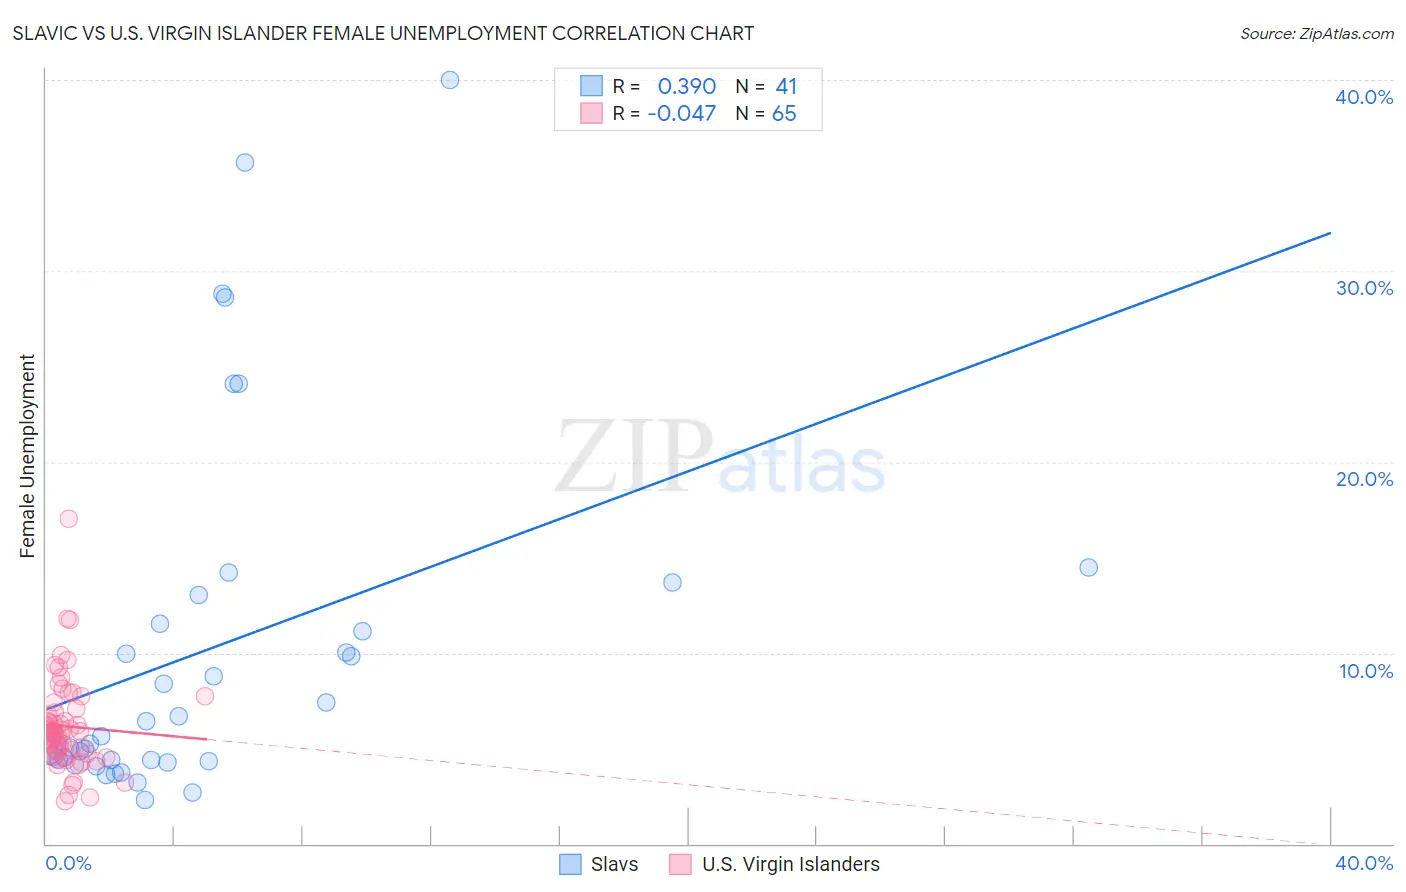
Slavic vs U.S. Virgin Islander Female Unemployment Correlation Chart
The statistical analysis conducted on geographies consisting of 269,881,664 people shows a mild positive correlation between the proportion of Slavs and unemploymnet rate among females in the United States with a correlation coefficient (R) of 0.390 and weighted average of 4.9%. Similarly, the statistical analysis conducted on geographies consisting of 87,490,240 people shows no correlation between the proportion of U.S. Virgin Islanders and unemploymnet rate among females in the United States with a correlation coefficient (R) of -0.047 and weighted average of 6.2%, a difference of 26.2%.
Female Unemployment Correlation Summary
| Measurement | Slavic | U.S. Virgin Islander |
| Minimum | 2.3% | 2.2% |
| Maximum | 40.0% | 17.0% |
| Range | 37.7% | 14.8% |
| Mean | 10.1% | 6.2% |
| Median | 5.7% | 5.9% |
| Interquartile 25% (IQ1) | 4.3% | 4.8% |
| Interquartile 75% (IQ3) | 12.3% | 7.0% |
| Interquartile Range (IQR) | 7.9% | 2.2% |
| Standard Deviation (Sample) | 9.3% | 2.4% |
| Standard Deviation (Population) | 9.2% | 2.4% |
Similar Demographics by Female Unemployment
Demographics Similar to Slavs by Female Unemployment
In terms of female unemployment, the demographic groups most similar to Slavs are Cambodian (4.9%, a difference of 0.020%), White/Caucasian (4.9%, a difference of 0.030%), Immigrants from Cuba (4.9%, a difference of 0.040%), Immigrants from Zimbabwe (4.9%, a difference of 0.090%), and Immigrants from Moldova (4.9%, a difference of 0.10%).
| Demographics | Rating | Rank | Female Unemployment |
| Austrians | 99.3 /100 | #45 | Exceptional 4.9% |
| Immigrants | Bulgaria | 99.3 /100 | #46 | Exceptional 4.9% |
| Okinawans | 99.3 /100 | #47 | Exceptional 4.9% |
| Thais | 99.2 /100 | #48 | Exceptional 4.9% |
| Australians | 99.2 /100 | #49 | Exceptional 4.9% |
| Immigrants | Cuba | 99.1 /100 | #50 | Exceptional 4.9% |
| Cambodians | 99.1 /100 | #51 | Exceptional 4.9% |
| Slavs | 99.1 /100 | #52 | Exceptional 4.9% |
| Whites/Caucasians | 99.0 /100 | #53 | Exceptional 4.9% |
| Immigrants | Zimbabwe | 99.0 /100 | #54 | Exceptional 4.9% |
| Immigrants | Moldova | 99.0 /100 | #55 | Exceptional 4.9% |
| Serbians | 99.0 /100 | #56 | Exceptional 4.9% |
| Icelanders | 98.8 /100 | #57 | Exceptional 4.9% |
| Immigrants | Lithuania | 98.8 /100 | #58 | Exceptional 4.9% |
| Bhutanese | 98.7 /100 | #59 | Exceptional 4.9% |
Demographics Similar to U.S. Virgin Islanders by Female Unemployment
In terms of female unemployment, the demographic groups most similar to U.S. Virgin Islanders are Immigrants from Barbados (6.2%, a difference of 0.15%), Barbadian (6.2%, a difference of 0.34%), Immigrants from Haiti (6.1%, a difference of 0.60%), Ute (6.1%, a difference of 0.65%), and Immigrants from Jamaica (6.2%, a difference of 0.71%).
| Demographics | Rating | Rank | Female Unemployment |
| Immigrants | Latin America | 0.0 /100 | #295 | Tragic 6.1% |
| Alaskan Athabascans | 0.0 /100 | #296 | Tragic 6.1% |
| West Indians | 0.0 /100 | #297 | Tragic 6.1% |
| Jamaicans | 0.0 /100 | #298 | Tragic 6.1% |
| Ute | 0.0 /100 | #299 | Tragic 6.1% |
| Immigrants | Haiti | 0.0 /100 | #300 | Tragic 6.1% |
| Immigrants | Barbados | 0.0 /100 | #301 | Tragic 6.2% |
| U.S. Virgin Islanders | 0.0 /100 | #302 | Tragic 6.2% |
| Barbadians | 0.0 /100 | #303 | Tragic 6.2% |
| Immigrants | Jamaica | 0.0 /100 | #304 | Tragic 6.2% |
| Spanish American Indians | 0.0 /100 | #305 | Tragic 6.2% |
| Immigrants | Central America | 0.0 /100 | #306 | Tragic 6.2% |
| Shoshone | 0.0 /100 | #307 | Tragic 6.2% |
| Hispanics or Latinos | 0.0 /100 | #308 | Tragic 6.2% |
| Ecuadorians | 0.0 /100 | #309 | Tragic 6.3% |