Slavic vs U.S. Virgin Islander Disability Age 18 to 34
COMPARE
Slavic
U.S. Virgin Islander
Disability Age 18 to 34
Disability Age 18 to 34 Comparison
Slavs
U.S. Virgin Islanders
7.4%
DISABILITY AGE 18 TO 34
0.1/ 100
METRIC RATING
273rd/ 347
METRIC RANK
6.7%
DISABILITY AGE 18 TO 34
38.6/ 100
METRIC RATING
182nd/ 347
METRIC RANK
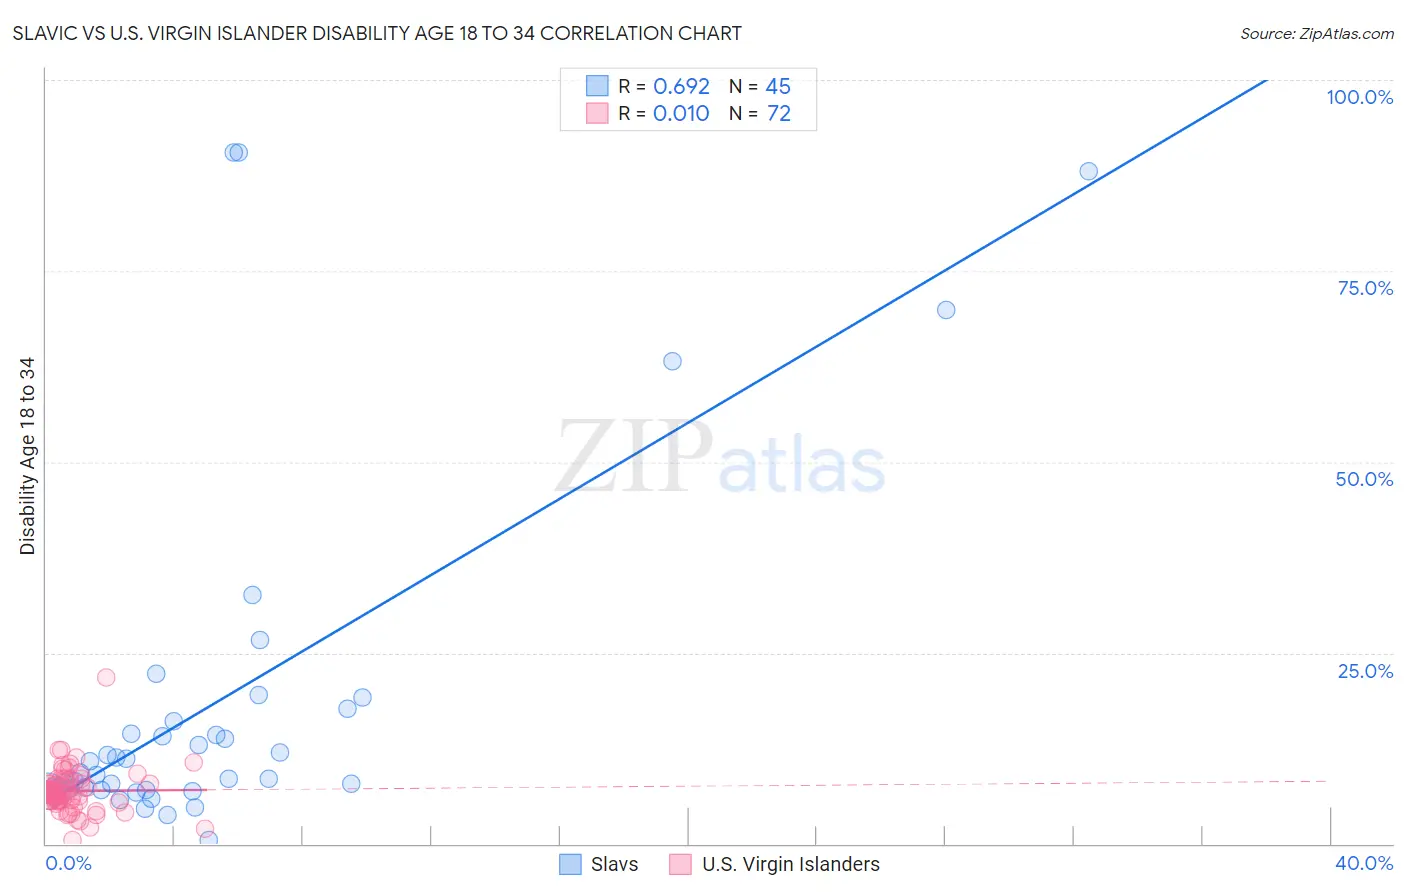
Slavic vs U.S. Virgin Islander Disability Age 18 to 34 Correlation Chart
The statistical analysis conducted on geographies consisting of 270,473,270 people shows a significant positive correlation between the proportion of Slavs and percentage of population with a disability between the ages 18 and 35 in the United States with a correlation coefficient (R) of 0.692 and weighted average of 7.4%. Similarly, the statistical analysis conducted on geographies consisting of 87,509,412 people shows no correlation between the proportion of U.S. Virgin Islanders and percentage of population with a disability between the ages 18 and 35 in the United States with a correlation coefficient (R) of 0.010 and weighted average of 6.7%, a difference of 11.2%.
Disability Age 18 to 34 Correlation Summary
| Measurement | Slavic | U.S. Virgin Islander |
| Minimum | 0.47% | 0.43% |
| Maximum | 90.5% | 21.7% |
| Range | 90.0% | 21.3% |
| Mean | 18.6% | 6.9% |
| Median | 9.3% | 6.7% |
| Interquartile 25% (IQ1) | 7.2% | 5.5% |
| Interquartile 75% (IQ3) | 16.9% | 8.1% |
| Interquartile Range (IQR) | 9.7% | 2.6% |
| Standard Deviation (Sample) | 23.2% | 2.9% |
| Standard Deviation (Population) | 23.0% | 2.9% |
Similar Demographics by Disability Age 18 to 34
Demographics Similar to Slavs by Disability Age 18 to 34
In terms of disability age 18 to 34, the demographic groups most similar to Slavs are African (7.4%, a difference of 0.010%), Tsimshian (7.4%, a difference of 0.050%), Immigrants from Somalia (7.4%, a difference of 0.080%), European (7.4%, a difference of 0.13%), and Swiss (7.4%, a difference of 0.14%).
| Demographics | Rating | Rank | Disability Age 18 to 34 |
| German Russians | 0.1 /100 | #266 | Tragic 7.4% |
| Bangladeshis | 0.1 /100 | #267 | Tragic 7.4% |
| Portuguese | 0.1 /100 | #268 | Tragic 7.4% |
| Basques | 0.1 /100 | #269 | Tragic 7.4% |
| Belgians | 0.1 /100 | #270 | Tragic 7.4% |
| Swiss | 0.1 /100 | #271 | Tragic 7.4% |
| Tsimshian | 0.1 /100 | #272 | Tragic 7.4% |
| Slavs | 0.1 /100 | #273 | Tragic 7.4% |
| Africans | 0.1 /100 | #274 | Tragic 7.4% |
| Immigrants | Somalia | 0.1 /100 | #275 | Tragic 7.4% |
| Europeans | 0.1 /100 | #276 | Tragic 7.4% |
| Immigrants | Portugal | 0.1 /100 | #277 | Tragic 7.4% |
| Lumbee | 0.1 /100 | #278 | Tragic 7.4% |
| Czechoslovakians | 0.1 /100 | #279 | Tragic 7.4% |
| Yaqui | 0.1 /100 | #280 | Tragic 7.4% |
Demographics Similar to U.S. Virgin Islanders by Disability Age 18 to 34
In terms of disability age 18 to 34, the demographic groups most similar to U.S. Virgin Islanders are Romanian (6.6%, a difference of 0.060%), Immigrants from Austria (6.6%, a difference of 0.070%), Immigrants from Iraq (6.7%, a difference of 0.090%), Iraqi (6.7%, a difference of 0.090%), and Immigrants from Oceania (6.7%, a difference of 0.24%).
| Demographics | Rating | Rank | Disability Age 18 to 34 |
| Immigrants | Cambodia | 46.5 /100 | #175 | Average 6.6% |
| Immigrants | Africa | 45.9 /100 | #176 | Average 6.6% |
| Syrians | 44.3 /100 | #177 | Average 6.6% |
| Nigerians | 43.7 /100 | #178 | Average 6.6% |
| Immigrants | Ghana | 42.1 /100 | #179 | Average 6.6% |
| Immigrants | Austria | 39.6 /100 | #180 | Fair 6.6% |
| Romanians | 39.5 /100 | #181 | Fair 6.6% |
| U.S. Virgin Islanders | 38.6 /100 | #182 | Fair 6.7% |
| Immigrants | Iraq | 37.4 /100 | #183 | Fair 6.7% |
| Iraqis | 37.4 /100 | #184 | Fair 6.7% |
| Immigrants | Oceania | 35.4 /100 | #185 | Fair 6.7% |
| Yup'ik | 35.3 /100 | #186 | Fair 6.7% |
| Maltese | 34.8 /100 | #187 | Fair 6.7% |
| Immigrants | Cameroon | 34.5 /100 | #188 | Fair 6.7% |
| Pakistanis | 33.7 /100 | #189 | Fair 6.7% |