British vs U.S. Virgin Islander 2 or more Vehicles in Household
COMPARE
British
U.S. Virgin Islander
2 or more Vehicles in Household
2 or more Vehicles in Household Comparison
British
U.S. Virgin Islanders
60.0%
2 OR MORE VEHICLES IN HOUSEHOLD
100.0/ 100
METRIC RATING
39th/ 347
METRIC RANK
47.5%
2 OR MORE VEHICLES IN HOUSEHOLD
0.0/ 100
METRIC RATING
313th/ 347
METRIC RANK
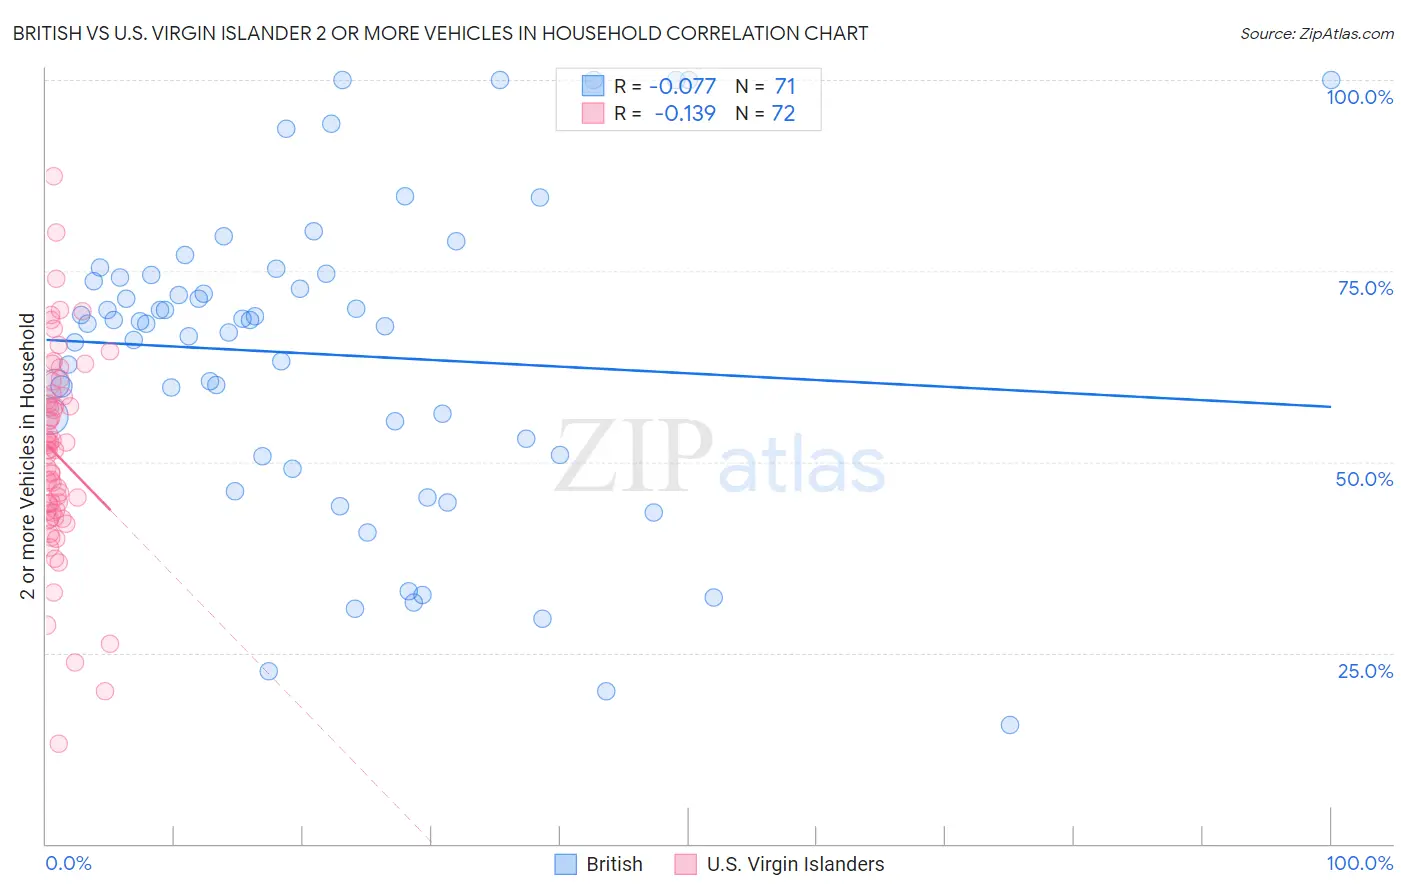
British vs U.S. Virgin Islander 2 or more Vehicles in Household Correlation Chart
The statistical analysis conducted on geographies consisting of 531,069,536 people shows a slight negative correlation between the proportion of British and percentage of households with 2 or more vehicles available in the United States with a correlation coefficient (R) of -0.077 and weighted average of 60.0%. Similarly, the statistical analysis conducted on geographies consisting of 87,429,921 people shows a poor negative correlation between the proportion of U.S. Virgin Islanders and percentage of households with 2 or more vehicles available in the United States with a correlation coefficient (R) of -0.139 and weighted average of 47.5%, a difference of 26.4%.
2 or more Vehicles in Household Correlation Summary
| Measurement | British | U.S. Virgin Islander |
| Minimum | 15.6% | 13.1% |
| Maximum | 100.0% | 87.3% |
| Range | 84.4% | 74.2% |
| Mean | 64.1% | 50.9% |
| Median | 68.1% | 51.5% |
| Interquartile 25% (IQ1) | 50.8% | 43.4% |
| Interquartile 75% (IQ3) | 74.5% | 58.4% |
| Interquartile Range (IQR) | 23.7% | 14.9% |
| Standard Deviation (Sample) | 20.1% | 13.1% |
| Standard Deviation (Population) | 20.0% | 13.0% |
Similar Demographics by 2 or more Vehicles in Household
Demographics Similar to British by 2 or more Vehicles in Household
In terms of 2 or more vehicles in household, the demographic groups most similar to British are American (60.0%, a difference of 0.0%), Irish (60.1%, a difference of 0.070%), Chinese (60.1%, a difference of 0.10%), Immigrants from Philippines (60.1%, a difference of 0.12%), and Spanish (60.2%, a difference of 0.25%).
| Demographics | Rating | Rank | 2 or more Vehicles in Household |
| Arapaho | 100.0 /100 | #32 | Exceptional 60.2% |
| Immigrants | Mexico | 100.0 /100 | #33 | Exceptional 60.2% |
| Spanish | 100.0 /100 | #34 | Exceptional 60.2% |
| Immigrants | Philippines | 100.0 /100 | #35 | Exceptional 60.1% |
| Chinese | 100.0 /100 | #36 | Exceptional 60.1% |
| Irish | 100.0 /100 | #37 | Exceptional 60.1% |
| Americans | 100.0 /100 | #38 | Exceptional 60.0% |
| British | 100.0 /100 | #39 | Exceptional 60.0% |
| Cherokee | 100.0 /100 | #40 | Exceptional 59.9% |
| Northern Europeans | 100.0 /100 | #41 | Exceptional 59.9% |
| Malaysians | 100.0 /100 | #42 | Exceptional 59.8% |
| Czechoslovakians | 100.0 /100 | #43 | Exceptional 59.8% |
| French | 100.0 /100 | #44 | Exceptional 59.8% |
| Immigrants | Taiwan | 100.0 /100 | #45 | Exceptional 59.7% |
| Immigrants | South Eastern Asia | 100.0 /100 | #46 | Exceptional 59.6% |
Demographics Similar to U.S. Virgin Islanders by 2 or more Vehicles in Household
In terms of 2 or more vehicles in household, the demographic groups most similar to U.S. Virgin Islanders are Haitian (47.6%, a difference of 0.17%), Immigrants from Ghana (47.4%, a difference of 0.22%), Puerto Rican (47.1%, a difference of 0.80%), Immigrants from Belarus (47.9%, a difference of 0.91%), and Ghanaian (48.0%, a difference of 1.0%).
| Demographics | Rating | Rank | 2 or more Vehicles in Household |
| Immigrants | Israel | 0.0 /100 | #306 | Tragic 49.2% |
| Hopi | 0.0 /100 | #307 | Tragic 49.0% |
| Albanians | 0.0 /100 | #308 | Tragic 49.0% |
| Moroccans | 0.0 /100 | #309 | Tragic 48.8% |
| Ghanaians | 0.0 /100 | #310 | Tragic 48.0% |
| Immigrants | Belarus | 0.0 /100 | #311 | Tragic 47.9% |
| Haitians | 0.0 /100 | #312 | Tragic 47.6% |
| U.S. Virgin Islanders | 0.0 /100 | #313 | Tragic 47.5% |
| Immigrants | Ghana | 0.0 /100 | #314 | Tragic 47.4% |
| Puerto Ricans | 0.0 /100 | #315 | Tragic 47.1% |
| Cape Verdeans | 0.0 /100 | #316 | Tragic 46.8% |
| Immigrants | Haiti | 0.0 /100 | #317 | Tragic 46.5% |
| Immigrants | Albania | 0.0 /100 | #318 | Tragic 46.0% |
| Jamaicans | 0.0 /100 | #319 | Tragic 45.8% |
| Soviet Union | 0.0 /100 | #320 | Tragic 45.7% |