Israeli vs U.S. Virgin Islander 2 or more Vehicles in Household
COMPARE
Israeli
U.S. Virgin Islander
2 or more Vehicles in Household
2 or more Vehicles in Household Comparison
Israelis
U.S. Virgin Islanders
51.9%
2 OR MORE VEHICLES IN HOUSEHOLD
0.2/ 100
METRIC RATING
273rd/ 347
METRIC RANK
47.5%
2 OR MORE VEHICLES IN HOUSEHOLD
0.0/ 100
METRIC RATING
313th/ 347
METRIC RANK
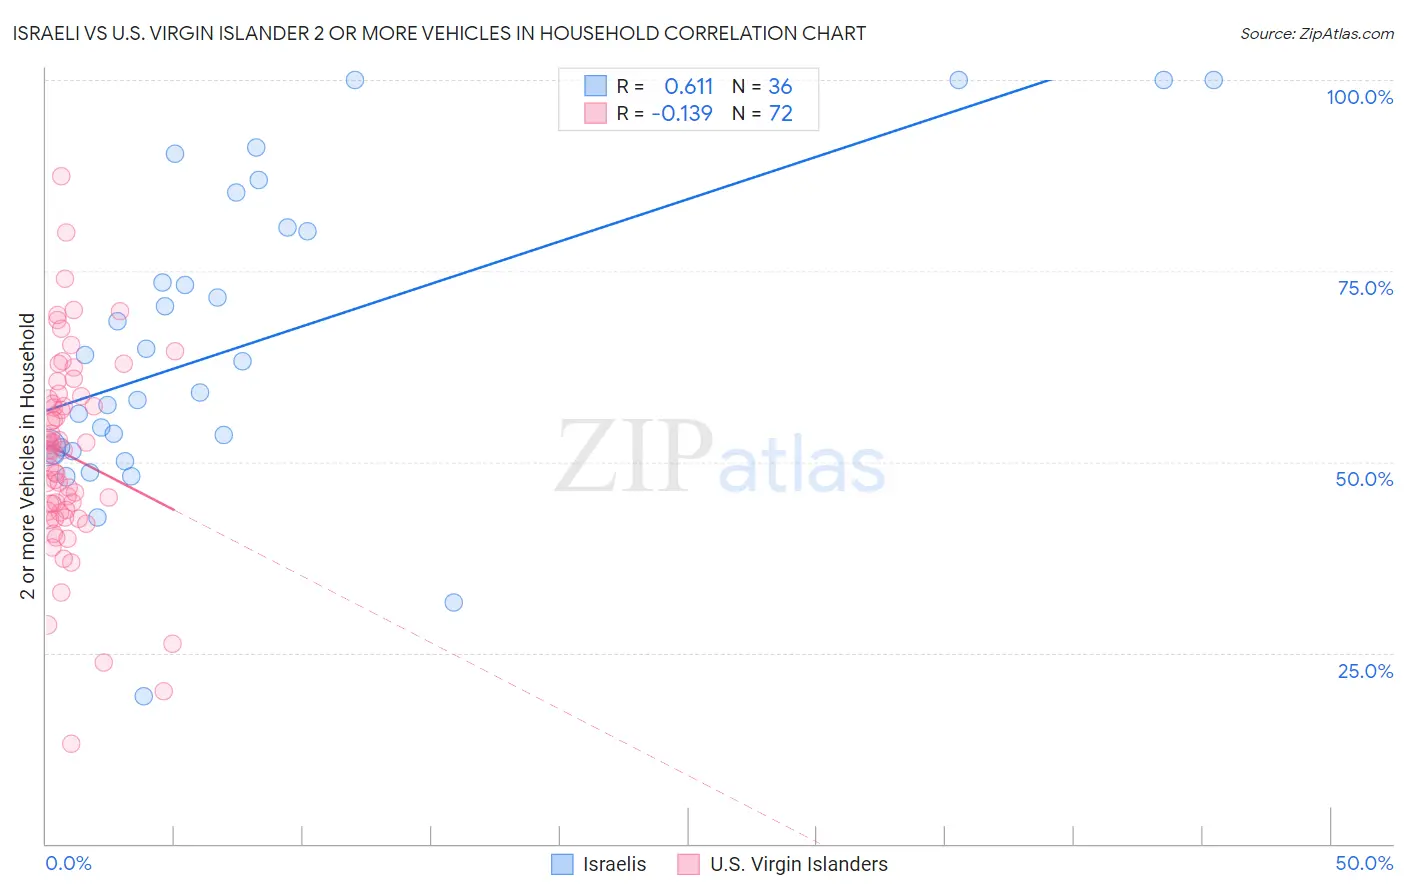
Israeli vs U.S. Virgin Islander 2 or more Vehicles in Household Correlation Chart
The statistical analysis conducted on geographies consisting of 211,040,574 people shows a significant positive correlation between the proportion of Israelis and percentage of households with 2 or more vehicles available in the United States with a correlation coefficient (R) of 0.611 and weighted average of 51.9%. Similarly, the statistical analysis conducted on geographies consisting of 87,429,921 people shows a poor negative correlation between the proportion of U.S. Virgin Islanders and percentage of households with 2 or more vehicles available in the United States with a correlation coefficient (R) of -0.139 and weighted average of 47.5%, a difference of 9.2%.
2 or more Vehicles in Household Correlation Summary
| Measurement | Israeli | U.S. Virgin Islander |
| Minimum | 19.3% | 13.1% |
| Maximum | 100.0% | 87.3% |
| Range | 80.7% | 74.2% |
| Mean | 65.3% | 50.9% |
| Median | 61.1% | 51.5% |
| Interquartile 25% (IQ1) | 51.6% | 43.4% |
| Interquartile 75% (IQ3) | 80.4% | 58.4% |
| Interquartile Range (IQR) | 28.8% | 14.9% |
| Standard Deviation (Sample) | 19.9% | 13.1% |
| Standard Deviation (Population) | 19.6% | 13.0% |
Similar Demographics by 2 or more Vehicles in Household
Demographics Similar to Israelis by 2 or more Vehicles in Household
In terms of 2 or more vehicles in household, the demographic groups most similar to Israelis are African (51.8%, a difference of 0.050%), Immigrants from Honduras (51.8%, a difference of 0.060%), Subsaharan African (51.9%, a difference of 0.090%), Immigrants from Croatia (51.8%, a difference of 0.090%), and South American (51.9%, a difference of 0.12%).
| Demographics | Rating | Rank | 2 or more Vehicles in Household |
| Immigrants | France | 0.2 /100 | #266 | Tragic 52.0% |
| Immigrants | Colombia | 0.2 /100 | #267 | Tragic 52.0% |
| Pima | 0.2 /100 | #268 | Tragic 52.0% |
| Hondurans | 0.2 /100 | #269 | Tragic 52.0% |
| Immigrants | Ireland | 0.2 /100 | #270 | Tragic 52.0% |
| South Americans | 0.2 /100 | #271 | Tragic 51.9% |
| Sub-Saharan Africans | 0.2 /100 | #272 | Tragic 51.9% |
| Israelis | 0.2 /100 | #273 | Tragic 51.9% |
| Africans | 0.2 /100 | #274 | Tragic 51.8% |
| Immigrants | Honduras | 0.2 /100 | #275 | Tragic 51.8% |
| Immigrants | Croatia | 0.2 /100 | #276 | Tragic 51.8% |
| Immigrants | Africa | 0.2 /100 | #277 | Tragic 51.8% |
| Yuman | 0.1 /100 | #278 | Tragic 51.7% |
| Liberians | 0.1 /100 | #279 | Tragic 51.7% |
| Immigrants | Eastern Europe | 0.1 /100 | #280 | Tragic 51.7% |
Demographics Similar to U.S. Virgin Islanders by 2 or more Vehicles in Household
In terms of 2 or more vehicles in household, the demographic groups most similar to U.S. Virgin Islanders are Haitian (47.6%, a difference of 0.17%), Immigrants from Ghana (47.4%, a difference of 0.22%), Puerto Rican (47.1%, a difference of 0.80%), Immigrants from Belarus (47.9%, a difference of 0.91%), and Ghanaian (48.0%, a difference of 1.0%).
| Demographics | Rating | Rank | 2 or more Vehicles in Household |
| Immigrants | Israel | 0.0 /100 | #306 | Tragic 49.2% |
| Hopi | 0.0 /100 | #307 | Tragic 49.0% |
| Albanians | 0.0 /100 | #308 | Tragic 49.0% |
| Moroccans | 0.0 /100 | #309 | Tragic 48.8% |
| Ghanaians | 0.0 /100 | #310 | Tragic 48.0% |
| Immigrants | Belarus | 0.0 /100 | #311 | Tragic 47.9% |
| Haitians | 0.0 /100 | #312 | Tragic 47.6% |
| U.S. Virgin Islanders | 0.0 /100 | #313 | Tragic 47.5% |
| Immigrants | Ghana | 0.0 /100 | #314 | Tragic 47.4% |
| Puerto Ricans | 0.0 /100 | #315 | Tragic 47.1% |
| Cape Verdeans | 0.0 /100 | #316 | Tragic 46.8% |
| Immigrants | Haiti | 0.0 /100 | #317 | Tragic 46.5% |
| Immigrants | Albania | 0.0 /100 | #318 | Tragic 46.0% |
| Jamaicans | 0.0 /100 | #319 | Tragic 45.8% |
| Soviet Union | 0.0 /100 | #320 | Tragic 45.7% |