Slavic vs Immigrants from Eastern Europe 2 or more Vehicles in Household
COMPARE
Slavic
Immigrants from Eastern Europe
2 or more Vehicles in Household
2 or more Vehicles in Household Comparison
Slavs
Immigrants from Eastern Europe
57.8%
2 OR MORE VEHICLES IN HOUSEHOLD
98.8/ 100
METRIC RATING
97th/ 347
METRIC RANK
51.7%
2 OR MORE VEHICLES IN HOUSEHOLD
0.1/ 100
METRIC RATING
280th/ 347
METRIC RANK
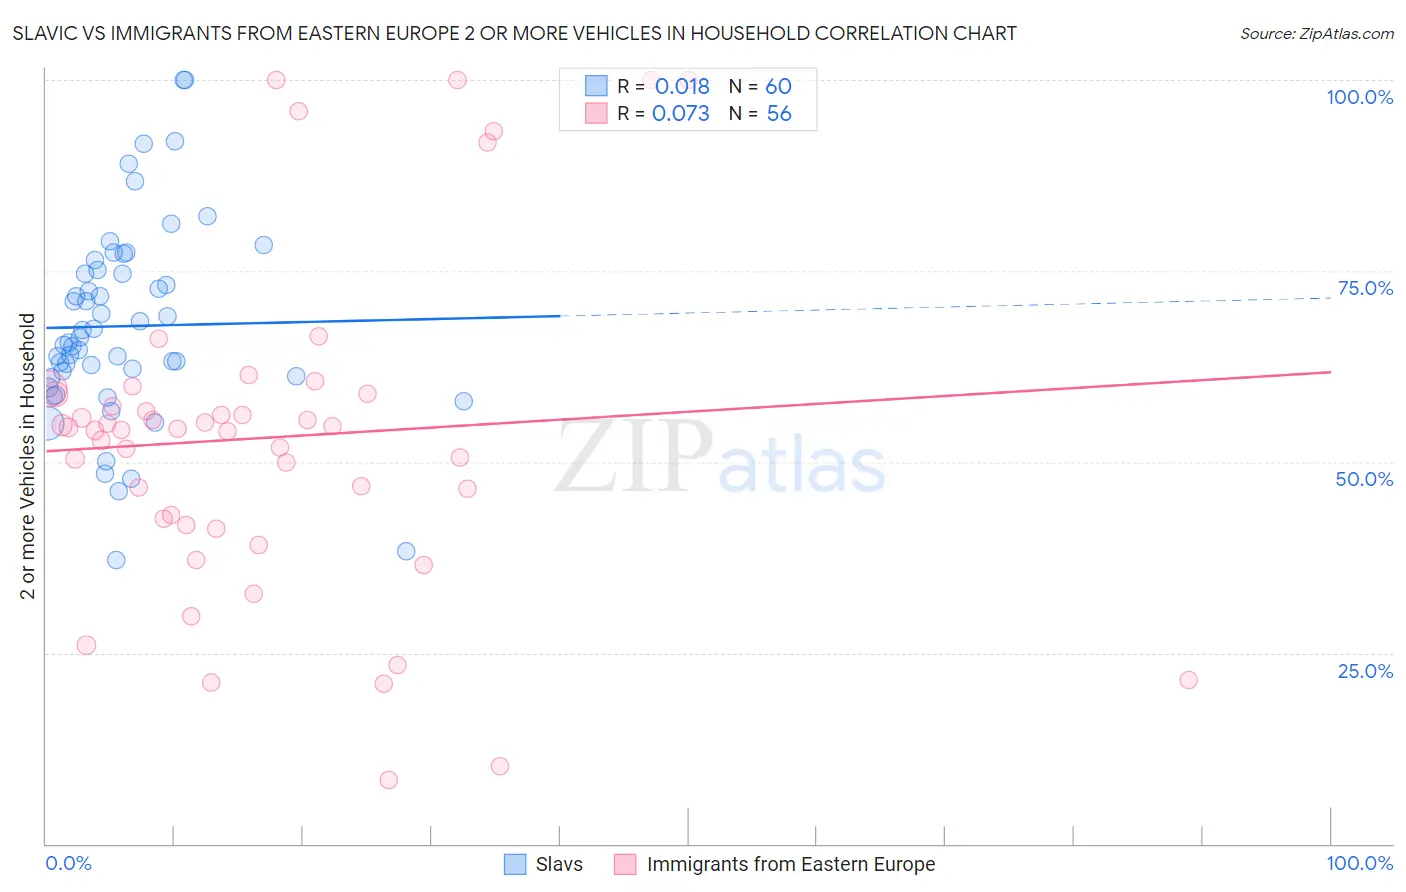
Slavic vs Immigrants from Eastern Europe 2 or more Vehicles in Household Correlation Chart
The statistical analysis conducted on geographies consisting of 270,821,936 people shows no correlation between the proportion of Slavs and percentage of households with 2 or more vehicles available in the United States with a correlation coefficient (R) of 0.018 and weighted average of 57.8%. Similarly, the statistical analysis conducted on geographies consisting of 475,538,372 people shows a slight positive correlation between the proportion of Immigrants from Eastern Europe and percentage of households with 2 or more vehicles available in the United States with a correlation coefficient (R) of 0.073 and weighted average of 51.7%, a difference of 11.7%.
2 or more Vehicles in Household Correlation Summary
| Measurement | Slavic | Immigrants from Eastern Europe |
| Minimum | 37.2% | 8.3% |
| Maximum | 100.0% | 100.0% |
| Range | 62.8% | 91.7% |
| Mean | 67.8% | 53.2% |
| Median | 66.0% | 54.2% |
| Interquartile 25% (IQ1) | 61.1% | 42.1% |
| Interquartile 75% (IQ3) | 74.9% | 58.9% |
| Interquartile Range (IQR) | 13.7% | 16.7% |
| Standard Deviation (Sample) | 12.9% | 21.5% |
| Standard Deviation (Population) | 12.8% | 21.3% |
Similar Demographics by 2 or more Vehicles in Household
Demographics Similar to Slavs by 2 or more Vehicles in Household
In terms of 2 or more vehicles in household, the demographic groups most similar to Slavs are Burmese (57.8%, a difference of 0.020%), Hmong (57.8%, a difference of 0.060%), Filipino (57.8%, a difference of 0.080%), Ottawa (57.9%, a difference of 0.14%), and Shoshone (57.9%, a difference of 0.15%).
| Demographics | Rating | Rank | 2 or more Vehicles in Household |
| Hispanics or Latinos | 99.0 /100 | #90 | Exceptional 57.9% |
| Pakistanis | 99.0 /100 | #91 | Exceptional 57.9% |
| Shoshone | 99.0 /100 | #92 | Exceptional 57.9% |
| Ottawa | 99.0 /100 | #93 | Exceptional 57.9% |
| Filipinos | 98.9 /100 | #94 | Exceptional 57.8% |
| Hmong | 98.9 /100 | #95 | Exceptional 57.8% |
| Burmese | 98.8 /100 | #96 | Exceptional 57.8% |
| Slavs | 98.8 /100 | #97 | Exceptional 57.8% |
| Palestinians | 98.6 /100 | #98 | Exceptional 57.7% |
| Cajuns | 98.5 /100 | #99 | Exceptional 57.7% |
| Fijians | 98.4 /100 | #100 | Exceptional 57.6% |
| Lebanese | 98.3 /100 | #101 | Exceptional 57.6% |
| Immigrants | Bolivia | 98.2 /100 | #102 | Exceptional 57.6% |
| Jordanians | 98.2 /100 | #103 | Exceptional 57.6% |
| Immigrants | Indonesia | 98.2 /100 | #104 | Exceptional 57.6% |
Demographics Similar to Immigrants from Eastern Europe by 2 or more Vehicles in Household
In terms of 2 or more vehicles in household, the demographic groups most similar to Immigrants from Eastern Europe are Liberian (51.7%, a difference of 0.030%), Yuman (51.7%, a difference of 0.040%), Immigrants from Africa (51.8%, a difference of 0.11%), Immigrants from Croatia (51.8%, a difference of 0.16%), and Immigrants from Honduras (51.8%, a difference of 0.19%).
| Demographics | Rating | Rank | 2 or more Vehicles in Household |
| Israelis | 0.2 /100 | #273 | Tragic 51.9% |
| Africans | 0.2 /100 | #274 | Tragic 51.8% |
| Immigrants | Honduras | 0.2 /100 | #275 | Tragic 51.8% |
| Immigrants | Croatia | 0.2 /100 | #276 | Tragic 51.8% |
| Immigrants | Africa | 0.2 /100 | #277 | Tragic 51.8% |
| Yuman | 0.1 /100 | #278 | Tragic 51.7% |
| Liberians | 0.1 /100 | #279 | Tragic 51.7% |
| Immigrants | Eastern Europe | 0.1 /100 | #280 | Tragic 51.7% |
| Immigrants | Kazakhstan | 0.1 /100 | #281 | Tragic 51.6% |
| Bahamians | 0.1 /100 | #282 | Tragic 51.5% |
| Immigrants | China | 0.1 /100 | #283 | Tragic 51.5% |
| Immigrants | Zaire | 0.1 /100 | #284 | Tragic 51.5% |
| Immigrants | Uruguay | 0.1 /100 | #285 | Tragic 51.4% |
| Immigrants | Liberia | 0.1 /100 | #286 | Tragic 51.3% |
| Immigrants | Serbia | 0.1 /100 | #287 | Tragic 51.3% |