Scottish vs Tlingit-Haida Child Poverty Under the Age of 16
COMPARE
Scottish
Tlingit-Haida
Child Poverty Under the Age of 16
Child Poverty Under the Age of 16 Comparison
Scottish
Tlingit-Haida
15.0%
CHILD POVERTY UNDER THE AGE OF 16
92.3/ 100
METRIC RATING
119th/ 347
METRIC RANK
14.9%
CHILD POVERTY UNDER THE AGE OF 16
94.1/ 100
METRIC RATING
109th/ 347
METRIC RANK
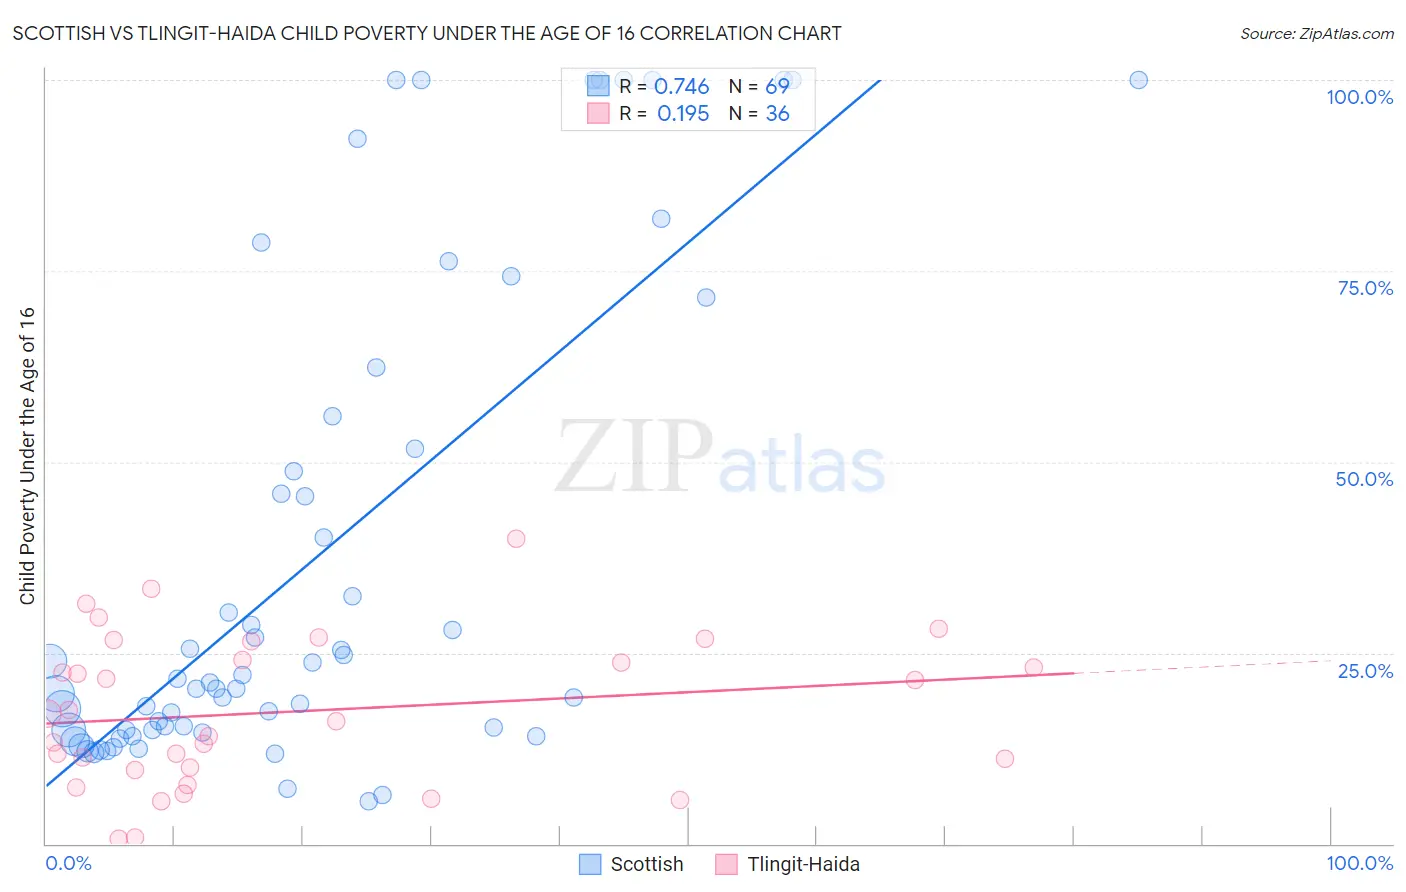
Scottish vs Tlingit-Haida Child Poverty Under the Age of 16 Correlation Chart
The statistical analysis conducted on geographies consisting of 554,294,508 people shows a strong positive correlation between the proportion of Scottish and poverty level among children under the age of 16 in the United States with a correlation coefficient (R) of 0.746 and weighted average of 15.0%. Similarly, the statistical analysis conducted on geographies consisting of 60,748,719 people shows a poor positive correlation between the proportion of Tlingit-Haida and poverty level among children under the age of 16 in the United States with a correlation coefficient (R) of 0.195 and weighted average of 14.9%, a difference of 0.92%.
Child Poverty Under the Age of 16 Correlation Summary
| Measurement | Scottish | Tlingit-Haida |
| Minimum | 5.6% | 0.72% |
| Maximum | 100.0% | 40.0% |
| Range | 94.4% | 39.3% |
| Mean | 37.1% | 17.4% |
| Median | 21.1% | 16.5% |
| Interquartile 25% (IQ1) | 14.9% | 9.8% |
| Interquartile 75% (IQ3) | 53.8% | 25.3% |
| Interquartile Range (IQR) | 38.9% | 15.5% |
| Standard Deviation (Sample) | 31.5% | 9.8% |
| Standard Deviation (Population) | 31.2% | 9.6% |
Demographics Similar to Scottish and Tlingit-Haida by Child Poverty Under the Age of 16
In terms of child poverty under the age of 16, the demographic groups most similar to Scottish are South African (15.0%, a difference of 0.090%), Immigrants from Zimbabwe (15.0%, a difference of 0.090%), Immigrants from Malaysia (15.0%, a difference of 0.15%), Immigrants from Norway (15.0%, a difference of 0.21%), and Pakistani (15.0%, a difference of 0.29%). Similarly, the demographic groups most similar to Tlingit-Haida are Jordanian (14.8%, a difference of 0.070%), Chilean (14.8%, a difference of 0.16%), Serbian (14.8%, a difference of 0.22%), English (14.9%, a difference of 0.34%), and Basque (14.8%, a difference of 0.35%).
| Demographics | Rating | Rank | Child Poverty Under the Age of 16 |
| Immigrants | England | 94.8 /100 | #104 | Exceptional 14.8% |
| Basques | 94.7 /100 | #105 | Exceptional 14.8% |
| Serbians | 94.5 /100 | #106 | Exceptional 14.8% |
| Chileans | 94.4 /100 | #107 | Exceptional 14.8% |
| Jordanians | 94.2 /100 | #108 | Exceptional 14.8% |
| Tlingit-Haida | 94.1 /100 | #109 | Exceptional 14.9% |
| English | 93.5 /100 | #110 | Exceptional 14.9% |
| Immigrants | Denmark | 93.5 /100 | #111 | Exceptional 14.9% |
| Irish | 93.4 /100 | #112 | Exceptional 14.9% |
| Belgians | 93.3 /100 | #113 | Exceptional 14.9% |
| Sri Lankans | 93.2 /100 | #114 | Exceptional 14.9% |
| Immigrants | Ukraine | 93.1 /100 | #115 | Exceptional 14.9% |
| Carpatho Rusyns | 93.1 /100 | #116 | Exceptional 14.9% |
| Immigrants | Norway | 92.8 /100 | #117 | Exceptional 15.0% |
| Immigrants | Malaysia | 92.6 /100 | #118 | Exceptional 15.0% |
| Scottish | 92.3 /100 | #119 | Exceptional 15.0% |
| South Africans | 92.1 /100 | #120 | Exceptional 15.0% |
| Immigrants | Zimbabwe | 92.1 /100 | #121 | Exceptional 15.0% |
| Pakistanis | 91.7 /100 | #122 | Exceptional 15.0% |
| Immigrants | Brazil | 91.1 /100 | #123 | Exceptional 15.1% |
| Czechoslovakians | 91.0 /100 | #124 | Exceptional 15.1% |