Scottish vs Tlingit-Haida Child Poverty Under the Age of 5
COMPARE
Scottish
Tlingit-Haida
Child Poverty Under the Age of 5
Child Poverty Under the Age of 5 Comparison
Scottish
Tlingit-Haida
16.9%
CHILD POVERTY UNDER THE AGE OF 5
68.6/ 100
METRIC RATING
163rd/ 347
METRIC RANK
15.9%
CHILD POVERTY UNDER THE AGE OF 5
94.7/ 100
METRIC RATING
106th/ 347
METRIC RANK
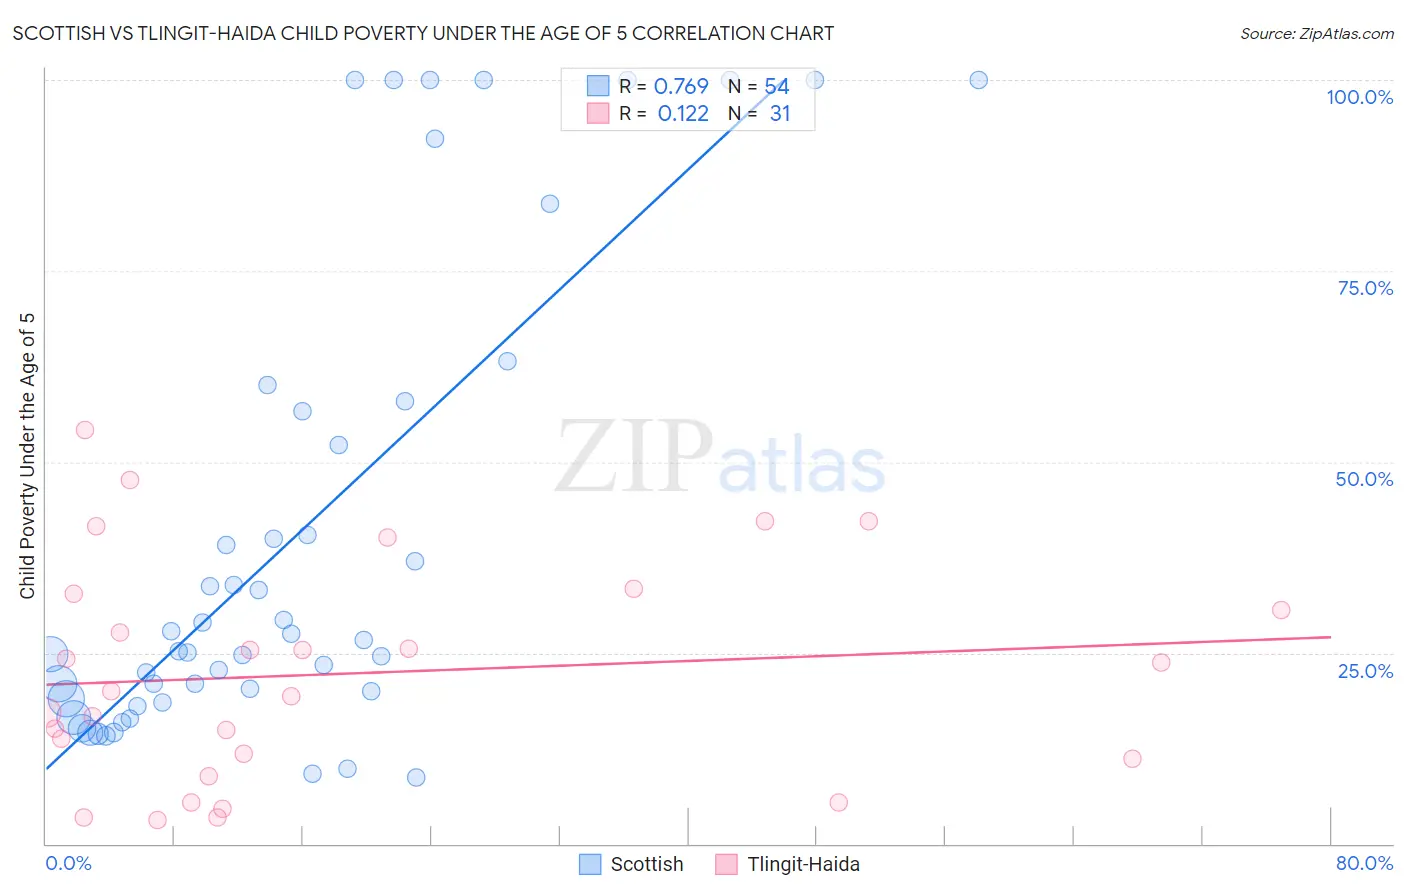
Scottish vs Tlingit-Haida Child Poverty Under the Age of 5 Correlation Chart
The statistical analysis conducted on geographies consisting of 526,633,659 people shows a strong positive correlation between the proportion of Scottish and poverty level among children under the age of 5 in the United States with a correlation coefficient (R) of 0.769 and weighted average of 16.9%. Similarly, the statistical analysis conducted on geographies consisting of 59,941,006 people shows a poor positive correlation between the proportion of Tlingit-Haida and poverty level among children under the age of 5 in the United States with a correlation coefficient (R) of 0.122 and weighted average of 15.9%, a difference of 5.9%.
Child Poverty Under the Age of 5 Correlation Summary
| Measurement | Scottish | Tlingit-Haida |
| Minimum | 8.7% | 3.0% |
| Maximum | 100.0% | 54.2% |
| Range | 91.3% | 51.2% |
| Mean | 40.1% | 22.3% |
| Median | 25.9% | 20.0% |
| Interquartile 25% (IQ1) | 18.9% | 11.1% |
| Interquartile 75% (IQ3) | 56.6% | 32.8% |
| Interquartile Range (IQR) | 37.6% | 21.7% |
| Standard Deviation (Sample) | 30.4% | 14.3% |
| Standard Deviation (Population) | 30.1% | 14.1% |
Similar Demographics by Child Poverty Under the Age of 5
Demographics Similar to Scottish by Child Poverty Under the Age of 5
In terms of child poverty under the age of 5, the demographic groups most similar to Scottish are Immigrants from Oceania (16.9%, a difference of 0.12%), Costa Rican (16.9%, a difference of 0.15%), English (16.8%, a difference of 0.21%), Immigrants from Colombia (16.9%, a difference of 0.21%), and Irish (16.8%, a difference of 0.43%).
| Demographics | Rating | Rank | Child Poverty Under the Age of 5 |
| Afghans | 74.4 /100 | #156 | Good 16.8% |
| Venezuelans | 73.7 /100 | #157 | Good 16.8% |
| Czechoslovakians | 72.5 /100 | #158 | Good 16.8% |
| Immigrants | Syria | 72.3 /100 | #159 | Good 16.8% |
| Irish | 72.0 /100 | #160 | Good 16.8% |
| English | 70.4 /100 | #161 | Good 16.8% |
| Costa Ricans | 69.8 /100 | #162 | Good 16.9% |
| Scottish | 68.6 /100 | #163 | Good 16.9% |
| Immigrants | Oceania | 67.6 /100 | #164 | Good 16.9% |
| Immigrants | Colombia | 66.9 /100 | #165 | Good 16.9% |
| Slavs | 64.0 /100 | #166 | Good 17.0% |
| Immigrants | Uzbekistan | 62.0 /100 | #167 | Good 17.0% |
| Uruguayans | 60.5 /100 | #168 | Good 17.0% |
| Immigrants | South America | 60.0 /100 | #169 | Good 17.1% |
| Immigrants | Western Asia | 59.2 /100 | #170 | Average 17.1% |
Demographics Similar to Tlingit-Haida by Child Poverty Under the Age of 5
In terms of child poverty under the age of 5, the demographic groups most similar to Tlingit-Haida are Immigrants from Spain (15.9%, a difference of 0.050%), Immigrants from North America (15.9%, a difference of 0.12%), Slovene (16.0%, a difference of 0.14%), Immigrants from Brazil (16.0%, a difference of 0.16%), and Northern European (16.0%, a difference of 0.24%).
| Demographics | Rating | Rank | Child Poverty Under the Age of 5 |
| Palestinians | 95.9 /100 | #99 | Exceptional 15.8% |
| Immigrants | Canada | 95.9 /100 | #100 | Exceptional 15.8% |
| Immigrants | Zimbabwe | 95.9 /100 | #101 | Exceptional 15.8% |
| Armenians | 95.7 /100 | #102 | Exceptional 15.8% |
| Europeans | 95.3 /100 | #103 | Exceptional 15.9% |
| Immigrants | North America | 94.9 /100 | #104 | Exceptional 15.9% |
| Immigrants | Spain | 94.8 /100 | #105 | Exceptional 15.9% |
| Tlingit-Haida | 94.7 /100 | #106 | Exceptional 15.9% |
| Slovenes | 94.4 /100 | #107 | Exceptional 16.0% |
| Immigrants | Brazil | 94.4 /100 | #108 | Exceptional 16.0% |
| Northern Europeans | 94.3 /100 | #109 | Exceptional 16.0% |
| Romanians | 94.3 /100 | #110 | Exceptional 16.0% |
| Pakistanis | 94.2 /100 | #111 | Exceptional 16.0% |
| Peruvians | 94.1 /100 | #112 | Exceptional 16.0% |
| Puget Sound Salish | 94.1 /100 | #113 | Exceptional 16.0% |