Scottish vs Nigerian 1 or more Vehicles in Household
COMPARE
Scottish
Nigerian
1 or more Vehicles in Household
1 or more Vehicles in Household Comparison
Scottish
Nigerians
93.4%
1 OR MORE VEHICLES IN HOUSEHOLD
100.0/ 100
METRIC RATING
7th/ 347
METRIC RANK
88.0%
1 OR MORE VEHICLES IN HOUSEHOLD
0.8/ 100
METRIC RATING
259th/ 347
METRIC RANK
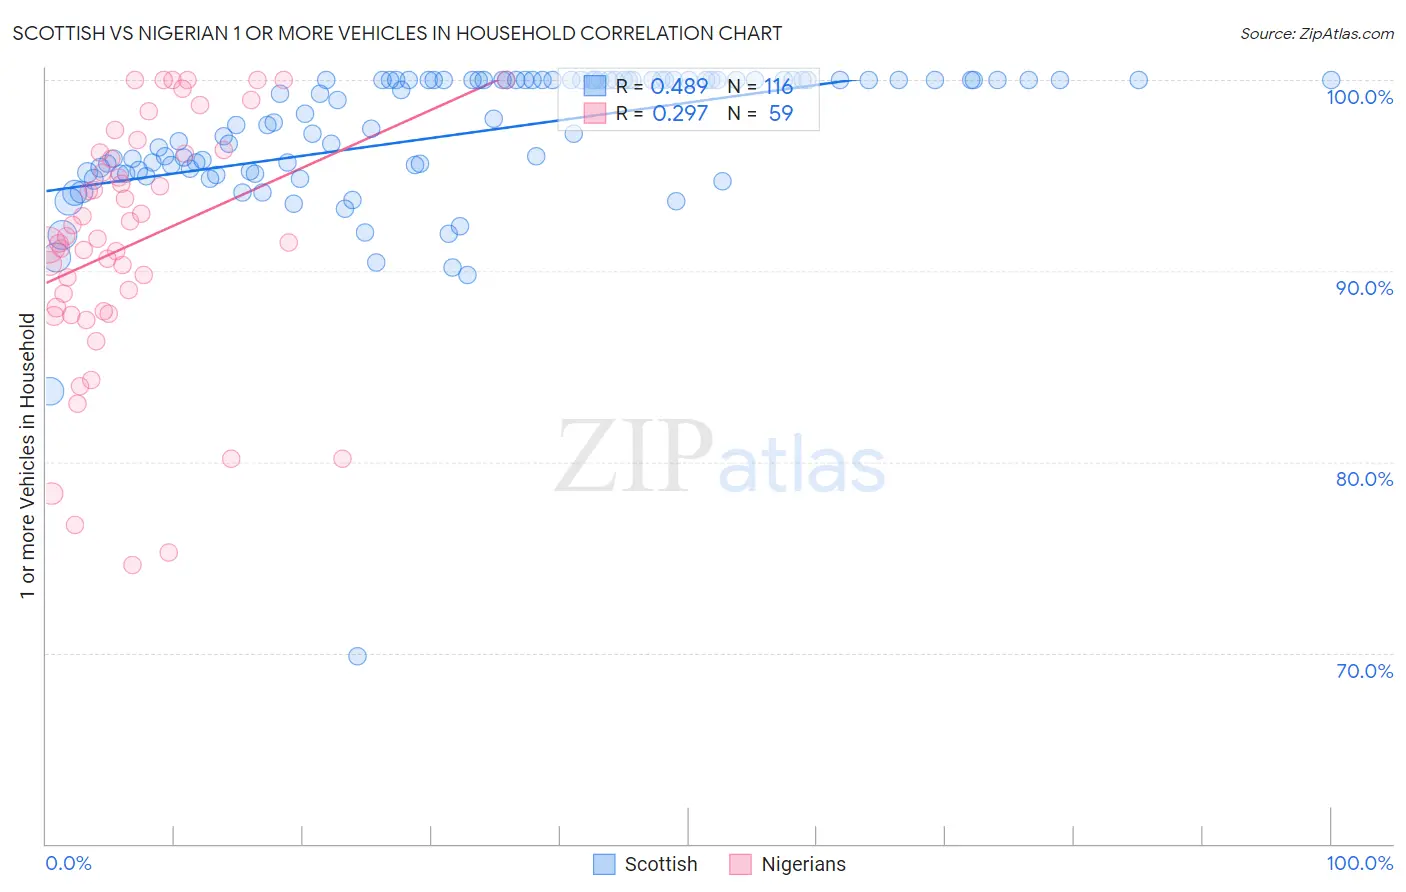
Scottish vs Nigerian 1 or more Vehicles in Household Correlation Chart
The statistical analysis conducted on geographies consisting of 566,661,783 people shows a moderate positive correlation between the proportion of Scottish and percentage of households with 1 or more vehicles available in the United States with a correlation coefficient (R) of 0.489 and weighted average of 93.4%. Similarly, the statistical analysis conducted on geographies consisting of 332,510,990 people shows a weak positive correlation between the proportion of Nigerians and percentage of households with 1 or more vehicles available in the United States with a correlation coefficient (R) of 0.297 and weighted average of 88.0%, a difference of 6.1%.
1 or more Vehicles in Household Correlation Summary
| Measurement | Scottish | Nigerian |
| Minimum | 69.8% | 74.6% |
| Maximum | 100.0% | 100.0% |
| Range | 30.2% | 25.4% |
| Mean | 97.1% | 91.4% |
| Median | 98.1% | 91.7% |
| Interquartile 25% (IQ1) | 95.2% | 87.9% |
| Interquartile 75% (IQ3) | 100.0% | 96.2% |
| Interquartile Range (IQR) | 4.8% | 8.3% |
| Standard Deviation (Sample) | 4.0% | 6.5% |
| Standard Deviation (Population) | 4.0% | 6.5% |
Similar Demographics by 1 or more Vehicles in Household
Demographics Similar to Scottish by 1 or more Vehicles in Household
In terms of 1 or more vehicles in household, the demographic groups most similar to Scottish are Swedish (93.3%, a difference of 0.040%), Scotch-Irish (93.3%, a difference of 0.060%), Dutch (93.3%, a difference of 0.080%), Czech (93.3%, a difference of 0.12%), and Danish (93.5%, a difference of 0.19%).
| Demographics | Rating | Rank | 1 or more Vehicles in Household |
| Luxembourgers | 100.0 /100 | #1 | Exceptional 94.8% |
| English | 100.0 /100 | #2 | Exceptional 93.8% |
| Norwegians | 100.0 /100 | #3 | Exceptional 93.7% |
| Germans | 100.0 /100 | #4 | Exceptional 93.6% |
| Yakama | 100.0 /100 | #5 | Exceptional 93.6% |
| Danes | 100.0 /100 | #6 | Exceptional 93.5% |
| Scottish | 100.0 /100 | #7 | Exceptional 93.4% |
| Swedes | 100.0 /100 | #8 | Exceptional 93.3% |
| Scotch-Irish | 100.0 /100 | #9 | Exceptional 93.3% |
| Dutch | 100.0 /100 | #10 | Exceptional 93.3% |
| Czechs | 100.0 /100 | #11 | Exceptional 93.3% |
| Scandinavians | 100.0 /100 | #12 | Exceptional 93.1% |
| Whites/Caucasians | 100.0 /100 | #13 | Exceptional 93.1% |
| Irish | 100.0 /100 | #14 | Exceptional 93.1% |
| Mexicans | 100.0 /100 | #15 | Exceptional 93.0% |
Demographics Similar to Nigerians by 1 or more Vehicles in Household
In terms of 1 or more vehicles in household, the demographic groups most similar to Nigerians are Liberian (88.0%, a difference of 0.030%), South American Indian (88.0%, a difference of 0.030%), Immigrants from Latvia (88.1%, a difference of 0.040%), Colombian (88.0%, a difference of 0.040%), and Honduran (88.1%, a difference of 0.070%).
| Demographics | Rating | Rank | 1 or more Vehicles in Household |
| Immigrants | Uruguay | 1.1 /100 | #252 | Tragic 88.1% |
| Hondurans | 1.0 /100 | #253 | Tragic 88.1% |
| Haitians | 0.9 /100 | #254 | Tragic 88.1% |
| Immigrants | Latvia | 0.9 /100 | #255 | Tragic 88.1% |
| Colombians | 0.9 /100 | #256 | Tragic 88.0% |
| Liberians | 0.9 /100 | #257 | Tragic 88.0% |
| South American Indians | 0.9 /100 | #258 | Tragic 88.0% |
| Nigerians | 0.8 /100 | #259 | Tragic 88.0% |
| Macedonians | 0.6 /100 | #260 | Tragic 87.9% |
| Immigrants | Switzerland | 0.6 /100 | #261 | Tragic 87.9% |
| Sub-Saharan Africans | 0.5 /100 | #262 | Tragic 87.9% |
| Immigrants | Egypt | 0.5 /100 | #263 | Tragic 87.8% |
| Immigrants | Liberia | 0.4 /100 | #264 | Tragic 87.8% |
| Africans | 0.4 /100 | #265 | Tragic 87.8% |
| Israelis | 0.3 /100 | #266 | Tragic 87.7% |