Scottish vs Portuguese 1 or more Vehicles in Household
COMPARE
Scottish
Portuguese
1 or more Vehicles in Household
1 or more Vehicles in Household Comparison
Scottish
Portuguese
93.4%
1 OR MORE VEHICLES IN HOUSEHOLD
100.0/ 100
METRIC RATING
7th/ 347
METRIC RANK
91.6%
1 OR MORE VEHICLES IN HOUSEHOLD
99.5/ 100
METRIC RATING
75th/ 347
METRIC RANK
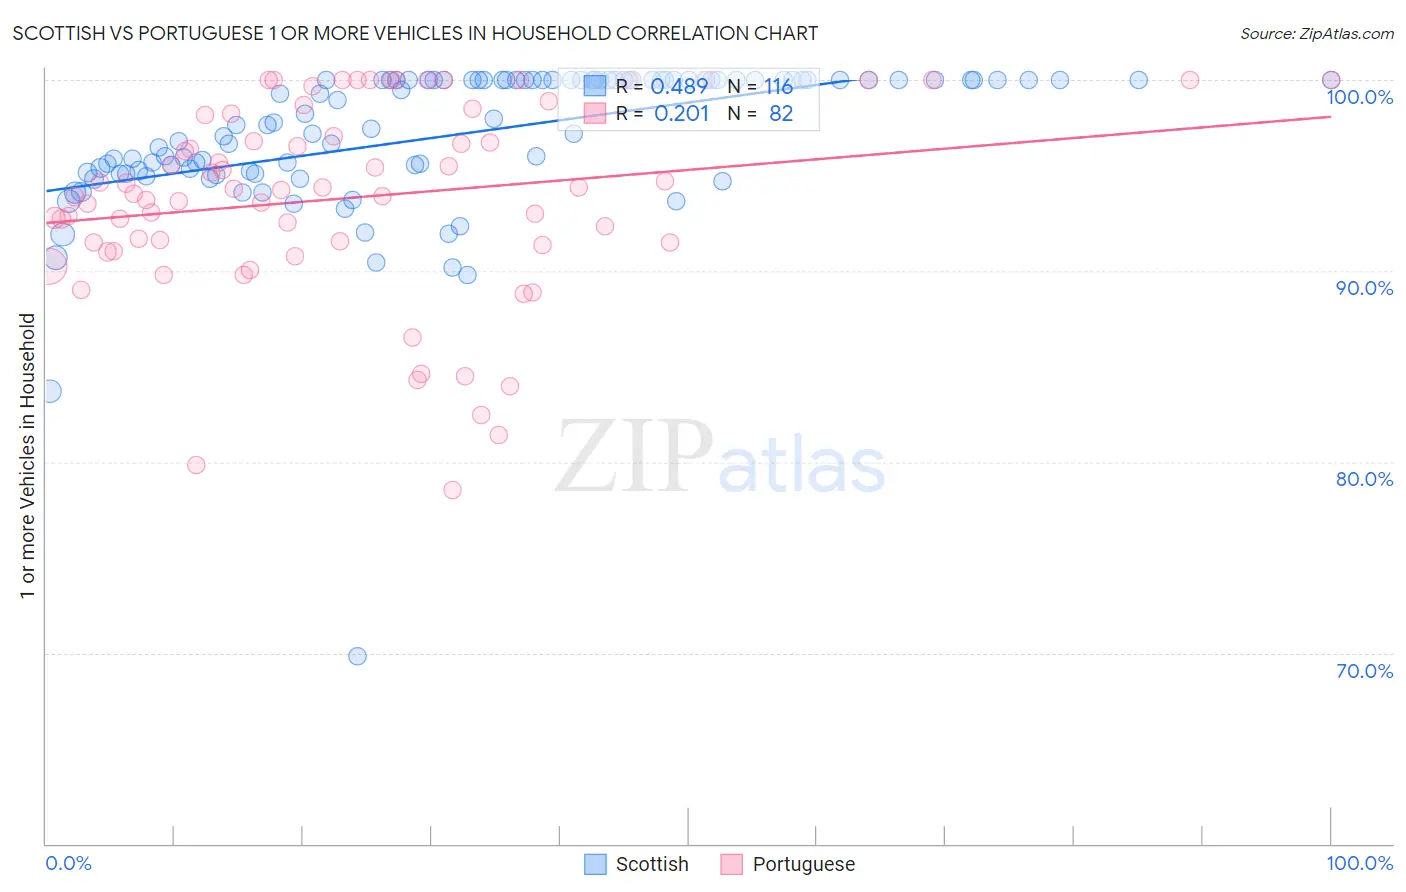
Scottish vs Portuguese 1 or more Vehicles in Household Correlation Chart
The statistical analysis conducted on geographies consisting of 566,661,783 people shows a moderate positive correlation between the proportion of Scottish and percentage of households with 1 or more vehicles available in the United States with a correlation coefficient (R) of 0.489 and weighted average of 93.4%. Similarly, the statistical analysis conducted on geographies consisting of 450,036,536 people shows a weak positive correlation between the proportion of Portuguese and percentage of households with 1 or more vehicles available in the United States with a correlation coefficient (R) of 0.201 and weighted average of 91.6%, a difference of 2.0%.
1 or more Vehicles in Household Correlation Summary
| Measurement | Scottish | Portuguese |
| Minimum | 69.8% | 78.5% |
| Maximum | 100.0% | 100.0% |
| Range | 30.2% | 21.5% |
| Mean | 97.1% | 93.8% |
| Median | 98.1% | 94.3% |
| Interquartile 25% (IQ1) | 95.2% | 91.5% |
| Interquartile 75% (IQ3) | 100.0% | 98.3% |
| Interquartile Range (IQR) | 4.8% | 6.8% |
| Standard Deviation (Sample) | 4.0% | 5.2% |
| Standard Deviation (Population) | 4.0% | 5.1% |
Similar Demographics by 1 or more Vehicles in Household
Demographics Similar to Scottish by 1 or more Vehicles in Household
In terms of 1 or more vehicles in household, the demographic groups most similar to Scottish are Swedish (93.3%, a difference of 0.040%), Scotch-Irish (93.3%, a difference of 0.060%), Dutch (93.3%, a difference of 0.080%), Czech (93.3%, a difference of 0.12%), and Danish (93.5%, a difference of 0.19%).
| Demographics | Rating | Rank | 1 or more Vehicles in Household |
| Luxembourgers | 100.0 /100 | #1 | Exceptional 94.8% |
| English | 100.0 /100 | #2 | Exceptional 93.8% |
| Norwegians | 100.0 /100 | #3 | Exceptional 93.7% |
| Germans | 100.0 /100 | #4 | Exceptional 93.6% |
| Yakama | 100.0 /100 | #5 | Exceptional 93.6% |
| Danes | 100.0 /100 | #6 | Exceptional 93.5% |
| Scottish | 100.0 /100 | #7 | Exceptional 93.4% |
| Swedes | 100.0 /100 | #8 | Exceptional 93.3% |
| Scotch-Irish | 100.0 /100 | #9 | Exceptional 93.3% |
| Dutch | 100.0 /100 | #10 | Exceptional 93.3% |
| Czechs | 100.0 /100 | #11 | Exceptional 93.3% |
| Scandinavians | 100.0 /100 | #12 | Exceptional 93.1% |
| Whites/Caucasians | 100.0 /100 | #13 | Exceptional 93.1% |
| Irish | 100.0 /100 | #14 | Exceptional 93.1% |
| Mexicans | 100.0 /100 | #15 | Exceptional 93.0% |
Demographics Similar to Portuguese by 1 or more Vehicles in Household
In terms of 1 or more vehicles in household, the demographic groups most similar to Portuguese are Cuban (91.5%, a difference of 0.020%), Immigrants from Philippines (91.5%, a difference of 0.060%), Iranian (91.5%, a difference of 0.060%), Immigrants from South Central Asia (91.5%, a difference of 0.080%), and Immigrants from Lebanon (91.6%, a difference of 0.090%).
| Demographics | Rating | Rank | 1 or more Vehicles in Household |
| Immigrants | Scotland | 99.7 /100 | #68 | Exceptional 91.8% |
| Palestinians | 99.7 /100 | #69 | Exceptional 91.7% |
| Lithuanians | 99.7 /100 | #70 | Exceptional 91.7% |
| Poles | 99.7 /100 | #71 | Exceptional 91.7% |
| Cajuns | 99.7 /100 | #72 | Exceptional 91.7% |
| Immigrants | Iran | 99.7 /100 | #73 | Exceptional 91.7% |
| Immigrants | Lebanon | 99.6 /100 | #74 | Exceptional 91.6% |
| Portuguese | 99.5 /100 | #75 | Exceptional 91.6% |
| Cubans | 99.5 /100 | #76 | Exceptional 91.5% |
| Immigrants | Philippines | 99.4 /100 | #77 | Exceptional 91.5% |
| Iranians | 99.4 /100 | #78 | Exceptional 91.5% |
| Immigrants | South Central Asia | 99.4 /100 | #79 | Exceptional 91.5% |
| Bolivians | 99.4 /100 | #80 | Exceptional 91.5% |
| Immigrants | South Eastern Asia | 99.3 /100 | #81 | Exceptional 91.4% |
| Lebanese | 99.3 /100 | #82 | Exceptional 91.4% |