Scottish vs Tlingit-Haida 10th Grade
COMPARE
Scottish
Tlingit-Haida
10th Grade
10th Grade Comparison
Scottish
Tlingit-Haida
95.6%
10TH GRADE
100.0/ 100
METRIC RATING
16th/ 347
METRIC RANK
95.7%
10TH GRADE
100.0/ 100
METRIC RATING
12th/ 347
METRIC RANK
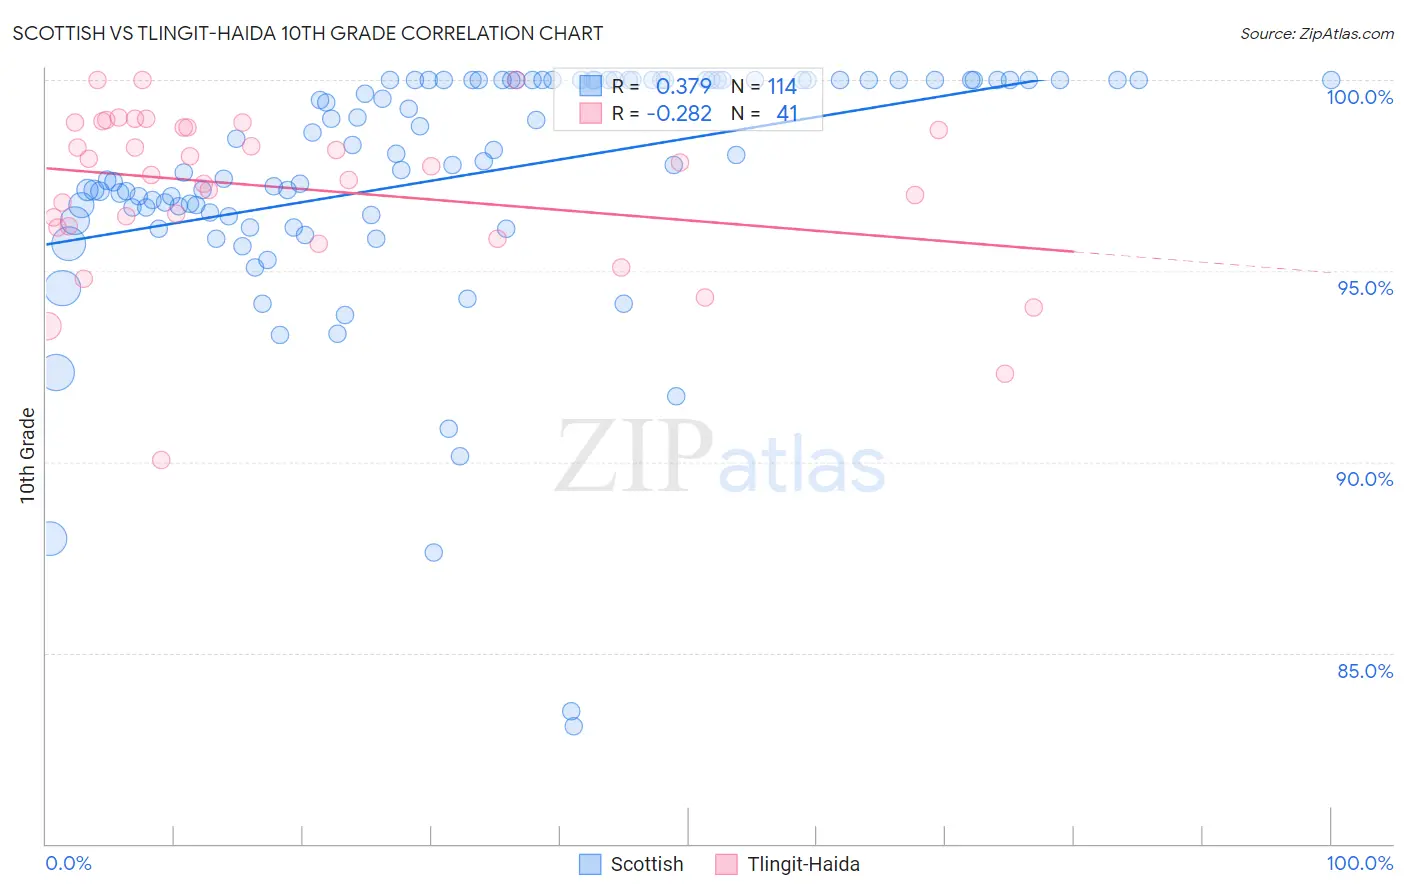
Scottish vs Tlingit-Haida 10th Grade Correlation Chart
The statistical analysis conducted on geographies consisting of 567,140,525 people shows a mild positive correlation between the proportion of Scottish and percentage of population with at least 10th grade education in the United States with a correlation coefficient (R) of 0.379 and weighted average of 95.6%. Similarly, the statistical analysis conducted on geographies consisting of 60,871,919 people shows a weak negative correlation between the proportion of Tlingit-Haida and percentage of population with at least 10th grade education in the United States with a correlation coefficient (R) of -0.282 and weighted average of 95.7%, a difference of 0.080%.
10th Grade Correlation Summary
| Measurement | Scottish | Tlingit-Haida |
| Minimum | 83.1% | 90.1% |
| Maximum | 100.0% | 100.0% |
| Range | 16.9% | 9.9% |
| Mean | 97.5% | 97.2% |
| Median | 97.9% | 97.7% |
| Interquartile 25% (IQ1) | 96.5% | 96.2% |
| Interquartile 75% (IQ3) | 100.0% | 98.8% |
| Interquartile Range (IQR) | 3.5% | 2.7% |
| Standard Deviation (Sample) | 3.2% | 2.1% |
| Standard Deviation (Population) | 3.2% | 2.1% |
Demographics Similar to Scottish and Tlingit-Haida by 10th Grade
In terms of 10th grade, the demographic groups most similar to Scottish are Irish (95.6%, a difference of 0.010%), Latvian (95.6%, a difference of 0.010%), Italian (95.6%, a difference of 0.020%), Scandinavian (95.6%, a difference of 0.020%), and Tsimshian (95.6%, a difference of 0.030%). Similarly, the demographic groups most similar to Tlingit-Haida are Danish (95.7%, a difference of 0.040%), English (95.6%, a difference of 0.040%), Tsimshian (95.6%, a difference of 0.040%), Irish (95.6%, a difference of 0.060%), and Croatian (95.7%, a difference of 0.080%).
| Demographics | Rating | Rank | 10th Grade |
| Swedes | 100.0 /100 | #4 | Exceptional 95.9% |
| Carpatho Rusyns | 100.0 /100 | #5 | Exceptional 95.9% |
| Poles | 100.0 /100 | #6 | Exceptional 95.8% |
| Germans | 100.0 /100 | #7 | Exceptional 95.8% |
| Lithuanians | 100.0 /100 | #8 | Exceptional 95.8% |
| Finns | 100.0 /100 | #9 | Exceptional 95.8% |
| Croatians | 100.0 /100 | #10 | Exceptional 95.7% |
| Danes | 100.0 /100 | #11 | Exceptional 95.7% |
| Tlingit-Haida | 100.0 /100 | #12 | Exceptional 95.7% |
| English | 100.0 /100 | #13 | Exceptional 95.6% |
| Tsimshian | 100.0 /100 | #14 | Exceptional 95.6% |
| Irish | 100.0 /100 | #15 | Exceptional 95.6% |
| Scottish | 100.0 /100 | #16 | Exceptional 95.6% |
| Latvians | 100.0 /100 | #17 | Exceptional 95.6% |
| Italians | 100.0 /100 | #18 | Exceptional 95.6% |
| Scandinavians | 100.0 /100 | #19 | Exceptional 95.6% |
| Chinese | 100.0 /100 | #20 | Exceptional 95.5% |
| Dutch | 100.0 /100 | #21 | Exceptional 95.5% |
| Eastern Europeans | 100.0 /100 | #22 | Exceptional 95.5% |
| Czechs | 100.0 /100 | #23 | Exceptional 95.5% |
| Europeans | 100.0 /100 | #24 | Exceptional 95.5% |