Pennsylvania German vs Immigrants from Italy 4 or more Vehicles in Household

COMPARE

Pennsylvania German
Race
Ancestry
AfghanAfricanAlaska NativeAlaskan AthabascanAlbanianAleutAlsatianAmericanApacheArabArapahoArgentineanArmenianAssyrian/Chaldean/SyriacAustralianAustrianBahamianBangladeshiBarbadianBasqueBelgianBelizeanBermudanBhutaneseBlackfeetBolivianBrazilianBritishBritish West IndianBulgarianBurmeseCajunCambodianCanadianCape VerdeanCarpatho RusynCelticCentral AmericanCentral American IndianCherokeeCheyenneChickasawChileanChineseChippewaChoctawColombianColvilleComancheCosta RicanCreeCreekCroatianCrowCubanCypriotCzechCzechoslovakianDanishDelawareDominicanDutchDutch West IndianEastern EuropeanEcuadorianEgyptianEnglishEstonianEthiopianEuropeanFijianFilipinoFinnishFrenchFrench American IndianFrench CanadianGermanGerman RussianGhanaianGreekGuamanian/ChamorroGuatemalanGuyaneseHaitianHmongHonduranHopiHoumaHungarianIcelanderIndian (Asian)IndonesianInupiatIranianIraqiIrishIroquoisIsraeliItalianJamaicanJapaneseJordanianKenyanKiowaKoreanLaotianLatvianLebaneseLiberianLithuanianLumbeeLuxembourgerMacedonianMalaysianMalteseMarshalleseMenomineeMexicanMexican American IndianMongolianMoroccanNative HawaiianNavajoNepaleseNew ZealanderNicaraguanNigerianNorthern EuropeanNorwegianOkinawanOsageOttawaPaiutePakistaniPalestinianPanamanianParaguayanPennsylvania GermanPeruvianPimaPolishPortuguesePotawatomiPuebloPuerto RicanPuget Sound SalishRomanianRussianSalvadoranSamoanScandinavianScotch-IrishScottishSeminoleSenegaleseSerbianShoshoneSierra LeoneanSiouxSlavicSlovakSloveneSomaliSouth AfricanSouth AmericanSouth American IndianSoviet UnionSpaniardSpanishSpanish AmericanSpanish American IndianSri LankanSubsaharan AfricanSudaneseSwedishSwissSyrianTaiwaneseThaiTlingit-HaidaTohono O'OdhamTonganTrinidadian and TobagonianTsimshianTurkishU.S. Virgin IslanderUgandanUkrainianUruguayanUteVenezuelanVietnameseWelshWest IndianYakamaYaquiYugoslavianYumanYup'ikZimbabwean
Immigration
NonimmigrantsImmigrantsAfghanistanAfricaAlbaniaArgentinaArmeniaAsiaAustraliaAustriaBahamasBangladeshBarbadosBelarusBelgiumBelizeBoliviaBosnia and HerzegovinaBrazilBulgariaBurma/MyanmarCabo VerdeCambodiaCameroonCanadaCaribbeanCentral AmericaChileChinaColombiaCongoCosta RicaCroatiaCubaCzechoslovakiaDenmarkDominicaDominican RepublicEastern AfricaEastern AsiaEastern EuropeEcuadorEgyptEl SalvadorEnglandEritreaEthiopiaEuropeFijiFranceGermanyGhanaGreeceGrenadaGuatemalaGuyanaHaitiHondurasHong KongHungaryIndiaIndonesiaIranIraqIrelandIsraelJamaicaJapanJordanKazakhstanKenyaKoreaKuwaitLaosLatin AmericaLatviaLebanonLiberiaLithuaniaMalaysiaMexicoMicronesiaMiddle AfricaMoldovaMoroccoNepalNetherlandsNicaraguaNigeriaNorth AmericaNorth MacedoniaNorthern AfricaNorthern EuropeNorwayOceaniaPakistanPanamaPeruPhilippinesPolandPortugalRomaniaRussiaSaudi ArabiaScotlandSenegalSerbiaSierra LeoneSingaporeSomaliaSouth AfricaSouth AmericaSouth Central AsiaSouth Eastern AsiaSouthern EuropeSpainSri LankaSt. Vincent and the GrenadinesSudanSwedenSwitzerlandSyriaTaiwanThailandTrinidad and TobagoTurkeyUgandaUkraineUruguayUzbekistanVenezuelaVietnamWest IndiesWestern AfricaWestern AsiaWestern EuropeYemenZaireZimbabweAzores
Immigrants from Italy
Race
Ancestry
AfghanAfricanAlaska NativeAlaskan AthabascanAlbanianAleutAlsatianAmericanApacheArabArapahoArgentineanArmenianAssyrian/Chaldean/SyriacAustralianAustrianBahamianBangladeshiBarbadianBasqueBelgianBelizeanBermudanBhutaneseBlackfeetBolivianBrazilianBritishBritish West IndianBulgarianBurmeseCajunCambodianCanadianCape VerdeanCarpatho RusynCelticCentral AmericanCentral American IndianCherokeeCheyenneChickasawChileanChineseChippewaChoctawColombianColvilleComancheCosta RicanCreeCreekCroatianCrowCubanCypriotCzechCzechoslovakianDanishDelawareDominicanDutchDutch West IndianEastern EuropeanEcuadorianEgyptianEnglishEstonianEthiopianEuropeanFijianFilipinoFinnishFrenchFrench American IndianFrench CanadianGermanGerman RussianGhanaianGreekGuamanian/ChamorroGuatemalanGuyaneseHaitianHmongHonduranHopiHoumaHungarianIcelanderIndian (Asian)IndonesianInupiatIranianIraqiIrishIroquoisIsraeliItalianJamaicanJapaneseJordanianKenyanKiowaKoreanLaotianLatvianLebaneseLiberianLithuanianLumbeeLuxembourgerMacedonianMalaysianMalteseMarshalleseMenomineeMexicanMexican American IndianMongolianMoroccanNative HawaiianNavajoNepaleseNew ZealanderNicaraguanNigerianNorthern EuropeanNorwegianOkinawanOsageOttawaPaiutePakistaniPalestinianPanamanianParaguayanPeruvianPimaPolishPortuguesePotawatomiPuebloPuerto RicanPuget Sound SalishRomanianRussianSalvadoranSamoanScandinavianScotch-IrishScottishSeminoleSenegaleseSerbianShoshoneSierra LeoneanSiouxSlavicSlovakSloveneSomaliSouth AfricanSouth AmericanSouth American IndianSoviet UnionSpaniardSpanishSpanish AmericanSpanish American IndianSri LankanSubsaharan AfricanSudaneseSwedishSwissSyrianTaiwaneseThaiTlingit-HaidaTohono O'OdhamTonganTrinidadian and TobagonianTsimshianTurkishU.S. Virgin IslanderUgandanUkrainianUruguayanUteVenezuelanVietnameseWelshWest IndianYakamaYaquiYugoslavianYumanYup'ikZimbabwean
Immigration
NonimmigrantsImmigrantsAfghanistanAfricaAlbaniaArgentinaArmeniaAsiaAustraliaAustriaBahamasBangladeshBarbadosBelarusBelgiumBelizeBoliviaBosnia and HerzegovinaBrazilBulgariaBurma/MyanmarCabo VerdeCambodiaCameroonCanadaCaribbeanCentral AmericaChileChinaColombiaCongoCosta RicaCroatiaCubaCzechoslovakiaDenmarkDominicaDominican RepublicEastern AfricaEastern AsiaEastern EuropeEcuadorEgyptEl SalvadorEnglandEritreaEthiopiaEuropeFijiFranceGermanyGhanaGreeceGrenadaGuatemalaGuyanaHaitiHondurasHong KongHungaryIndiaIndonesiaIranIraqIrelandIsraelItalyJamaicaJapanJordanKazakhstanKenyaKoreaKuwaitLaosLatin AmericaLatviaLebanonLiberiaLithuaniaMalaysiaMexicoMicronesiaMiddle AfricaMoldovaMoroccoNepalNetherlandsNicaraguaNigeriaNorth AmericaNorth MacedoniaNorthern AfricaNorthern EuropeNorwayOceaniaPakistanPanamaPeruPhilippinesPolandPortugalRomaniaRussiaSaudi ArabiaScotlandSenegalSerbiaSierra LeoneSingaporeSomaliaSouth AfricaSouth AmericaSouth Central AsiaSouth Eastern AsiaSouthern EuropeSpainSri LankaSt. Vincent and the GrenadinesSudanSwedenSwitzerlandSyriaTaiwanThailandTrinidad and TobagoTurkeyUgandaUkraineUruguayUzbekistanVenezuelaVietnamWest IndiesWestern AfricaWestern AsiaWestern EuropeYemenZaireZimbabweAzores
4 or more Vehicles in Household
Income
Poverty
Unemployment
Labor Participation
Family Structure
Vehicle Availability
Education Level
Disability

4 or more Vehicles in Household Comparison

Pennsylvania Germans

Immigrants from Italy

Exceptional
Poor
7.6%
4 OR MORE VEHICLES IN HOUSEHOLD
100.0/ 100
METRIC RATING
57th/ 347
METRIC RANK
6.0%
4 OR MORE VEHICLES IN HOUSEHOLD
11.0/ 100
METRIC RATING
218th/ 347
METRIC RANK

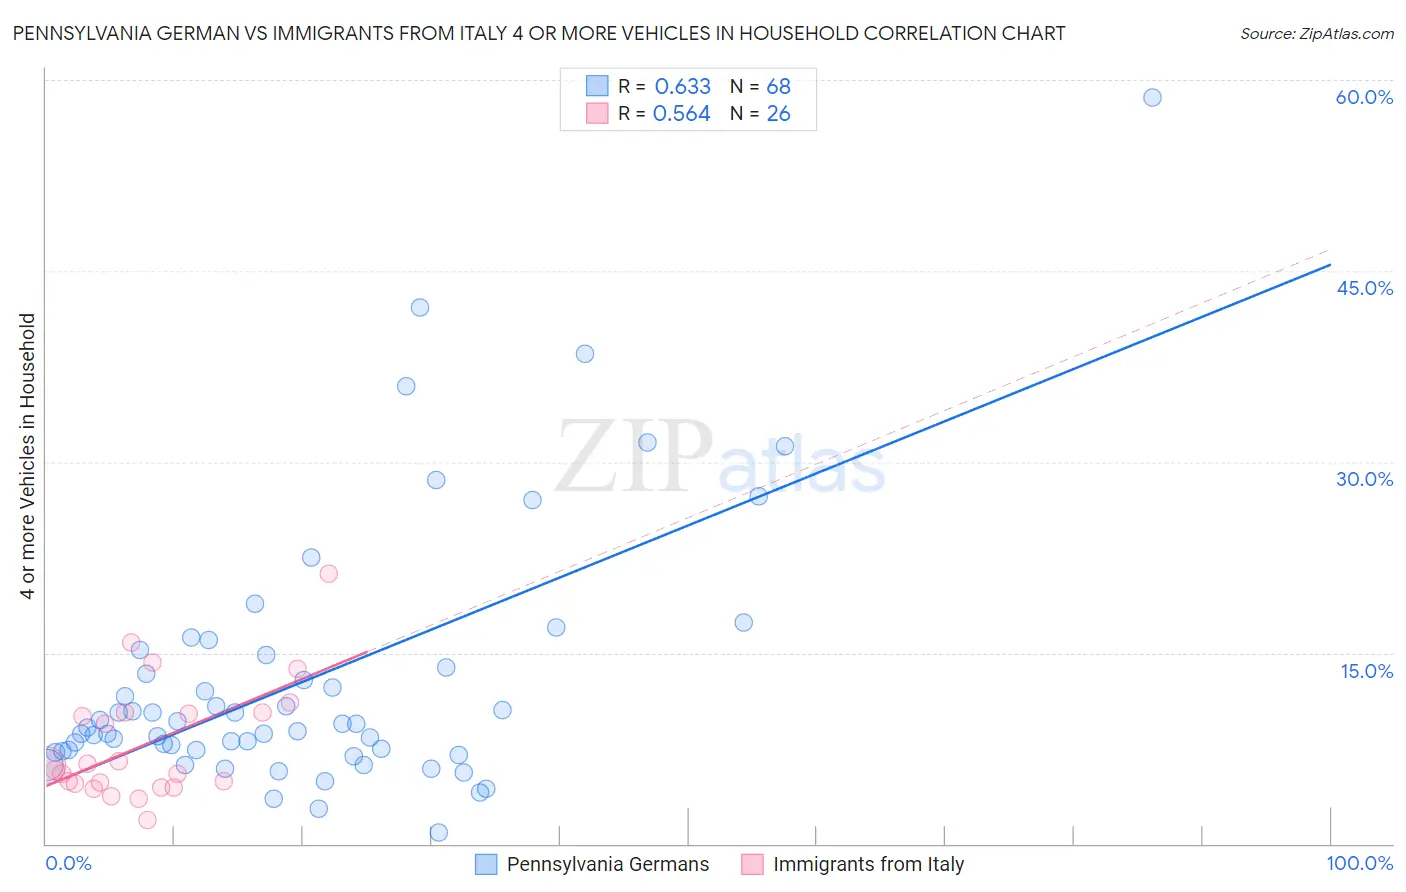
Pennsylvania German vs Immigrants from Italy 4 or more Vehicles in Household Correlation Chart

The statistical analysis conducted on geographies consisting of 233,625,360 people shows a significant positive correlation between the proportion of Pennsylvania Germans and percentage of households with 4 or more vehicles available in the United States with a correlation coefficient (R) of 0.633 and weighted average of 7.6%. Similarly, the statistical analysis conducted on geographies consisting of 322,662,886 people shows a substantial positive correlation between the proportion of Immigrants from Italy and percentage of households with 4 or more vehicles available in the United States with a correlation coefficient (R) of 0.564 and weighted average of 6.0%, a difference of 27.2%.
Pennsylvania German vs Immigrants from Italy 4 or more Vehicles in Household

4 or more Vehicles in Household Correlation Summary

MeasurementPennsylvania GermanImmigrants from Italy
Minimum0.85%1.9%
Maximum58.6%21.2%
Range57.8%19.3%
Mean12.9%7.8%
Median9.3%6.0%
Interquartile 25% (IQ1)7.3%4.7%
Interquartile 75% (IQ3)14.4%10.3%
Interquartile Range (IQR)7.1%5.6%
Standard Deviation (Sample)10.3%4.6%
Standard Deviation (Population)10.3%4.5%

Similar Demographics by 4 or more Vehicles in Household

Demographics Similar to Pennsylvania Germans by 4 or more Vehicles in Household

In terms of 4 or more vehicles in household, the demographic groups most similar to Pennsylvania Germans are Swedish (7.6%, a difference of 0.0%), Hispanic or Latino (7.6%, a difference of 0.040%), Spaniard (7.6%, a difference of 0.10%), English (7.6%, a difference of 0.12%), and Immigrants from Oceania (7.6%, a difference of 0.14%).
DemographicsRating | Rank4 or more Vehicles in Household
Immigrants | El Salvador
100.0
/100
|
#50
Exceptional
7.7%
Immigrants | Laos
100.0
/100
|
#51
Exceptional
7.7%
Japanese
100.0
/100
|
#52
Exceptional
7.7%
Malaysians
100.0
/100
|
#53
Exceptional
7.7%
Dutch
100.0
/100
|
#54
Exceptional
7.7%
Immigrants | Oceania
100.0
/100
|
#55
Exceptional
7.6%
English
100.0
/100
|
#56
Exceptional
7.6%
Pennsylvania Germans
100.0
/100
|
#57
Exceptional
7.6%
Swedes
100.0
/100
|
#58
Exceptional
7.6%
Hispanics or Latinos
100.0
/100
|
#59
Exceptional
7.6%
Spaniards
100.0
/100
|
#60
Exceptional
7.6%
Europeans
100.0
/100
|
#61
Exceptional
7.6%
Chippewa
100.0
/100
|
#62
Exceptional
7.6%
Immigrants | Micronesia
100.0
/100
|
#63
Exceptional
7.6%
Bangladeshis
100.0
/100
|
#64
Exceptional
7.6%

Demographics Similar to Immigrants from Italy by 4 or more Vehicles in Household

In terms of 4 or more vehicles in household, the demographic groups most similar to Immigrants from Italy are Serbian (6.0%, a difference of 0.0%), Russian (6.0%, a difference of 0.19%), Nigerian (6.0%, a difference of 0.31%), Immigrants from Moldova (6.0%, a difference of 0.49%), and Cajun (6.0%, a difference of 0.52%).
DemographicsRating | Rank4 or more Vehicles in Household
Panamanians
14.8
/100
|
#211
Poor
6.0%
Immigrants | Egypt
14.7
/100
|
#212
Poor
6.0%
Arabs
14.4
/100
|
#213
Poor
6.0%
Immigrants | Austria
14.3
/100
|
#214
Poor
6.0%
Immigrants | China
13.8
/100
|
#215
Poor
6.0%
Immigrants | Romania
13.8
/100
|
#216
Poor
6.0%
Nigerians
12.2
/100
|
#217
Poor
6.0%
Immigrants | Italy
11.0
/100
|
#218
Poor
6.0%
Serbians
11.0
/100
|
#219
Poor
6.0%
Russians
10.3
/100
|
#220
Poor
6.0%
Immigrants | Moldova
9.3
/100
|
#221
Tragic
6.0%
Cajuns
9.2
/100
|
#222
Tragic
6.0%
Immigrants | Kenya
9.2
/100
|
#223
Tragic
6.0%
Cubans
9.2
/100
|
#224
Tragic
6.0%
Indonesians
8.9
/100
|
#225
Tragic
6.0%