Luxembourger vs Immigrants from Italy 4 or more Vehicles in Household
COMPARE
Luxembourger
Immigrants from Italy
4 or more Vehicles in Household
4 or more Vehicles in Household Comparison
Luxembourgers
Immigrants from Italy
6.6%
4 OR MORE VEHICLES IN HOUSEHOLD
86.4/ 100
METRIC RATING
136th/ 347
METRIC RANK
6.0%
4 OR MORE VEHICLES IN HOUSEHOLD
11.0/ 100
METRIC RATING
218th/ 347
METRIC RANK
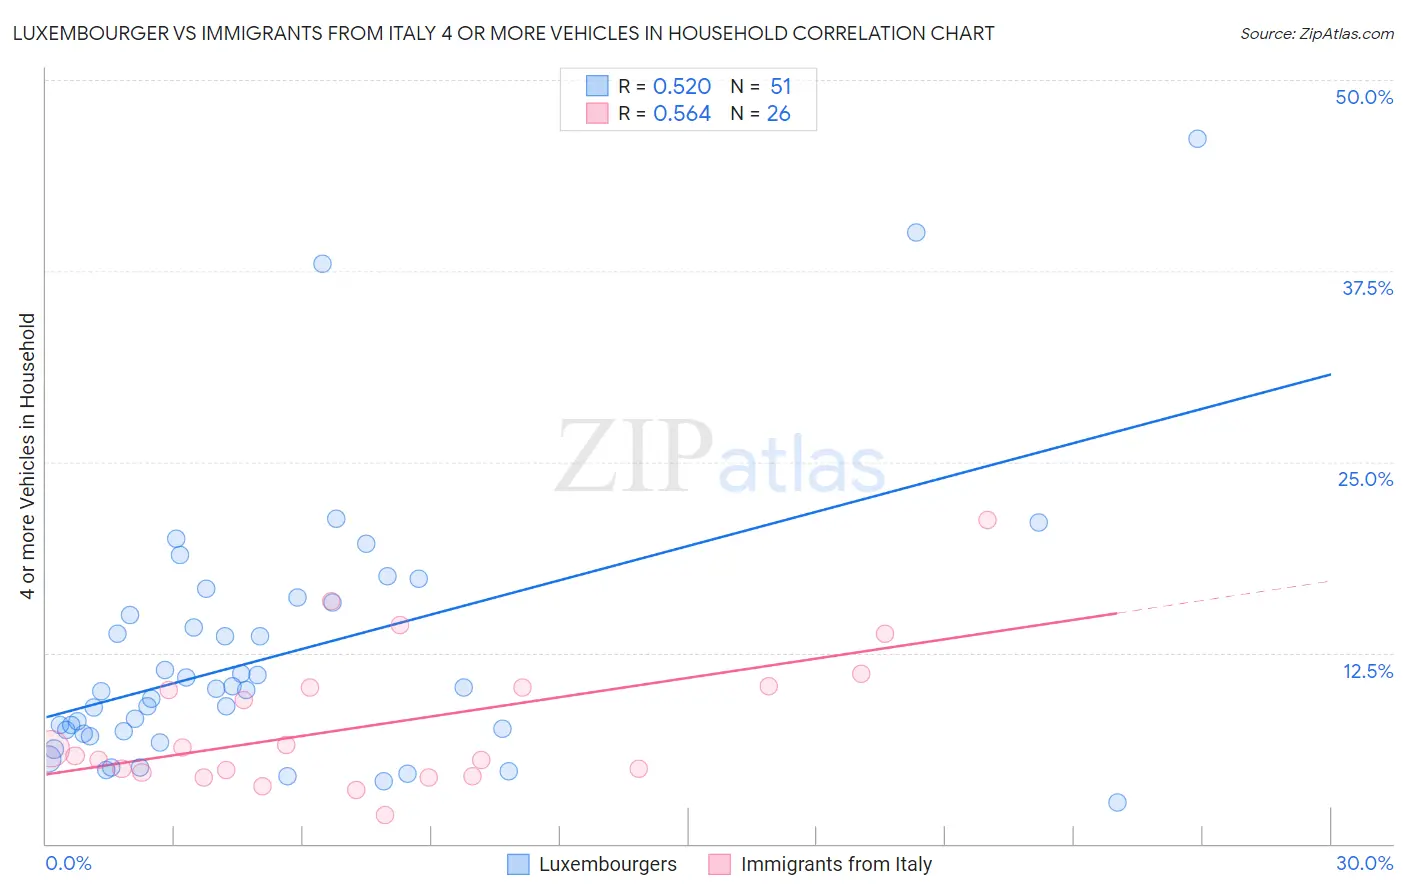
Luxembourger vs Immigrants from Italy 4 or more Vehicles in Household Correlation Chart
The statistical analysis conducted on geographies consisting of 144,419,010 people shows a substantial positive correlation between the proportion of Luxembourgers and percentage of households with 4 or more vehicles available in the United States with a correlation coefficient (R) of 0.520 and weighted average of 6.6%. Similarly, the statistical analysis conducted on geographies consisting of 322,662,886 people shows a substantial positive correlation between the proportion of Immigrants from Italy and percentage of households with 4 or more vehicles available in the United States with a correlation coefficient (R) of 0.564 and weighted average of 6.0%, a difference of 10.5%.
4 or more Vehicles in Household Correlation Summary
| Measurement | Luxembourger | Immigrants from Italy |
| Minimum | 2.7% | 1.9% |
| Maximum | 46.2% | 21.2% |
| Range | 43.5% | 19.3% |
| Mean | 12.4% | 7.8% |
| Median | 10.0% | 6.0% |
| Interquartile 25% (IQ1) | 7.2% | 4.7% |
| Interquartile 75% (IQ3) | 15.8% | 10.3% |
| Interquartile Range (IQR) | 8.6% | 5.6% |
| Standard Deviation (Sample) | 8.8% | 4.6% |
| Standard Deviation (Population) | 8.7% | 4.5% |
Similar Demographics by 4 or more Vehicles in Household
Demographics Similar to Luxembourgers by 4 or more Vehicles in Household
In terms of 4 or more vehicles in household, the demographic groups most similar to Luxembourgers are Tohono O'odham (6.6%, a difference of 0.070%), Ottawa (6.6%, a difference of 0.10%), Armenian (6.6%, a difference of 0.11%), French Canadian (6.6%, a difference of 0.21%), and Immigrants from Netherlands (6.6%, a difference of 0.31%).
| Demographics | Rating | Rank | 4 or more Vehicles in Household |
| Immigrants | England | 92.0 /100 | #129 | Exceptional 6.7% |
| Immigrants | Scotland | 89.0 /100 | #130 | Excellent 6.7% |
| Maltese | 88.4 /100 | #131 | Excellent 6.7% |
| Immigrants | Netherlands | 87.8 /100 | #132 | Excellent 6.6% |
| Armenians | 86.9 /100 | #133 | Excellent 6.6% |
| Ottawa | 86.9 /100 | #134 | Excellent 6.6% |
| Tohono O'odham | 86.7 /100 | #135 | Excellent 6.6% |
| Luxembourgers | 86.4 /100 | #136 | Excellent 6.6% |
| French Canadians | 85.4 /100 | #137 | Excellent 6.6% |
| Italians | 84.5 /100 | #138 | Excellent 6.6% |
| Jordanians | 82.1 /100 | #139 | Excellent 6.6% |
| Slavs | 81.6 /100 | #140 | Excellent 6.6% |
| Australians | 80.8 /100 | #141 | Excellent 6.6% |
| Immigrants | Iraq | 79.4 /100 | #142 | Good 6.5% |
| Immigrants | Canada | 78.6 /100 | #143 | Good 6.5% |
Demographics Similar to Immigrants from Italy by 4 or more Vehicles in Household
In terms of 4 or more vehicles in household, the demographic groups most similar to Immigrants from Italy are Serbian (6.0%, a difference of 0.0%), Russian (6.0%, a difference of 0.19%), Nigerian (6.0%, a difference of 0.31%), Immigrants from Moldova (6.0%, a difference of 0.49%), and Cajun (6.0%, a difference of 0.52%).
| Demographics | Rating | Rank | 4 or more Vehicles in Household |
| Panamanians | 14.8 /100 | #211 | Poor 6.0% |
| Immigrants | Egypt | 14.7 /100 | #212 | Poor 6.0% |
| Arabs | 14.4 /100 | #213 | Poor 6.0% |
| Immigrants | Austria | 14.3 /100 | #214 | Poor 6.0% |
| Immigrants | China | 13.8 /100 | #215 | Poor 6.0% |
| Immigrants | Romania | 13.8 /100 | #216 | Poor 6.0% |
| Nigerians | 12.2 /100 | #217 | Poor 6.0% |
| Immigrants | Italy | 11.0 /100 | #218 | Poor 6.0% |
| Serbians | 11.0 /100 | #219 | Poor 6.0% |
| Russians | 10.3 /100 | #220 | Poor 6.0% |
| Immigrants | Moldova | 9.3 /100 | #221 | Tragic 6.0% |
| Cajuns | 9.2 /100 | #222 | Tragic 6.0% |
| Immigrants | Kenya | 9.2 /100 | #223 | Tragic 6.0% |
| Cubans | 9.2 /100 | #224 | Tragic 6.0% |
| Indonesians | 8.9 /100 | #225 | Tragic 6.0% |