Scandinavian vs Immigrants from Italy 9th Grade
COMPARE
Scandinavian
Immigrants from Italy
9th Grade
9th Grade Comparison
Scandinavians
Immigrants from Italy
96.5%
9TH GRADE
100.0/ 100
METRIC RATING
18th/ 347
METRIC RANK
95.0%
9TH GRADE
66.6/ 100
METRIC RATING
160th/ 347
METRIC RANK
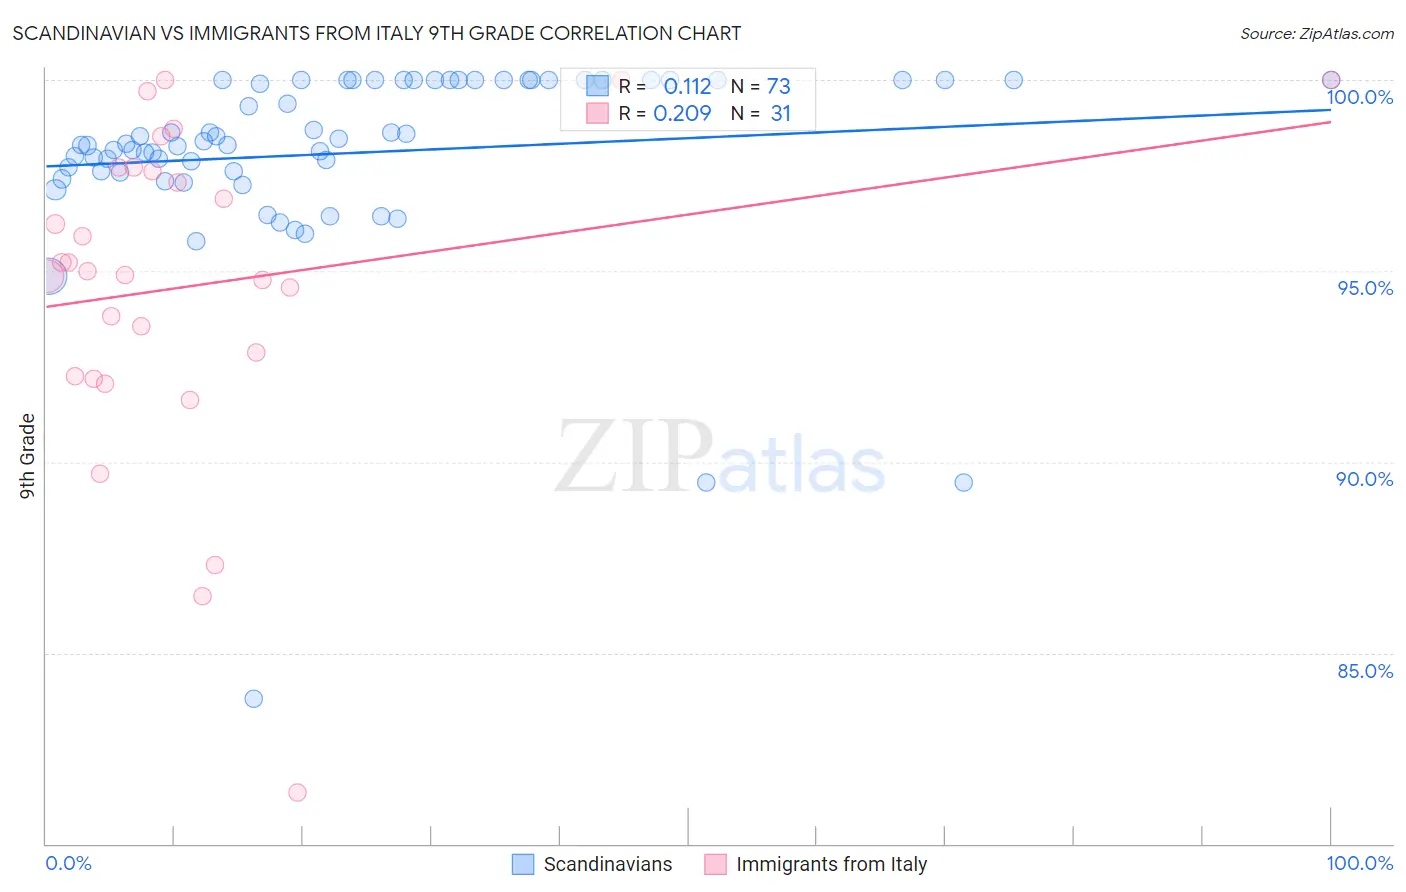
Scandinavian vs Immigrants from Italy 9th Grade Correlation Chart
The statistical analysis conducted on geographies consisting of 472,660,435 people shows a poor positive correlation between the proportion of Scandinavians and percentage of population with at least 9th grade education in the United States with a correlation coefficient (R) of 0.112 and weighted average of 96.5%. Similarly, the statistical analysis conducted on geographies consisting of 324,225,686 people shows a weak positive correlation between the proportion of Immigrants from Italy and percentage of population with at least 9th grade education in the United States with a correlation coefficient (R) of 0.209 and weighted average of 95.0%, a difference of 1.5%.
9th Grade Correlation Summary
| Measurement | Scandinavian | Immigrants from Italy |
| Minimum | 83.8% | 81.3% |
| Maximum | 100.0% | 100.0% |
| Range | 16.2% | 18.7% |
| Mean | 98.1% | 94.6% |
| Median | 98.3% | 95.0% |
| Interquartile 25% (IQ1) | 97.6% | 92.3% |
| Interquartile 75% (IQ3) | 100.0% | 97.7% |
| Interquartile Range (IQR) | 2.4% | 5.5% |
| Standard Deviation (Sample) | 2.6% | 4.3% |
| Standard Deviation (Population) | 2.6% | 4.2% |
Similar Demographics by 9th Grade
Demographics Similar to Scandinavians by 9th Grade
In terms of 9th grade, the demographic groups most similar to Scandinavians are Dutch (96.5%, a difference of 0.020%), Welsh (96.4%, a difference of 0.040%), Italian (96.4%, a difference of 0.040%), Alaskan Athabascan (96.4%, a difference of 0.050%), and European (96.4%, a difference of 0.060%).
| Demographics | Rating | Rank | 9th Grade |
| Finns | 100.0 /100 | #11 | Exceptional 96.6% |
| English | 100.0 /100 | #12 | Exceptional 96.6% |
| Danes | 100.0 /100 | #13 | Exceptional 96.5% |
| Scottish | 100.0 /100 | #14 | Exceptional 96.5% |
| Irish | 100.0 /100 | #15 | Exceptional 96.5% |
| Croatians | 100.0 /100 | #16 | Exceptional 96.5% |
| Dutch | 100.0 /100 | #17 | Exceptional 96.5% |
| Scandinavians | 100.0 /100 | #18 | Exceptional 96.5% |
| Welsh | 100.0 /100 | #19 | Exceptional 96.4% |
| Italians | 100.0 /100 | #20 | Exceptional 96.4% |
| Alaskan Athabascans | 100.0 /100 | #21 | Exceptional 96.4% |
| Europeans | 100.0 /100 | #22 | Exceptional 96.4% |
| Czechs | 100.0 /100 | #23 | Exceptional 96.4% |
| Latvians | 100.0 /100 | #24 | Exceptional 96.4% |
| French | 100.0 /100 | #25 | Exceptional 96.3% |
Demographics Similar to Immigrants from Italy by 9th Grade
In terms of 9th grade, the demographic groups most similar to Immigrants from Italy are French American Indian (95.0%, a difference of 0.0%), Immigrants from Ukraine (95.0%, a difference of 0.010%), Bermudan (95.0%, a difference of 0.010%), Pakistani (95.0%, a difference of 0.020%), and Venezuelan (95.0%, a difference of 0.020%).
| Demographics | Rating | Rank | 9th Grade |
| Albanians | 76.1 /100 | #153 | Good 95.1% |
| Arabs | 74.9 /100 | #154 | Good 95.1% |
| Immigrants | Kazakhstan | 74.7 /100 | #155 | Good 95.1% |
| Immigrants | Kenya | 73.1 /100 | #156 | Good 95.0% |
| Mongolians | 73.0 /100 | #157 | Good 95.0% |
| Egyptians | 70.1 /100 | #158 | Good 95.0% |
| Immigrants | Ukraine | 67.4 /100 | #159 | Good 95.0% |
| Immigrants | Italy | 66.6 /100 | #160 | Good 95.0% |
| French American Indians | 66.5 /100 | #161 | Good 95.0% |
| Bermudans | 65.8 /100 | #162 | Good 95.0% |
| Pakistanis | 64.1 /100 | #163 | Good 95.0% |
| Venezuelans | 63.6 /100 | #164 | Good 95.0% |
| Blackfeet | 62.6 /100 | #165 | Good 95.0% |
| Ute | 62.6 /100 | #166 | Good 95.0% |
| Immigrants | Brazil | 61.1 /100 | #167 | Good 95.0% |