Pakistani vs Immigrants from Burma/Myanmar No Vehicles in Household
COMPARE
Pakistani
Immigrants from Burma/Myanmar
No Vehicles in Household
No Vehicles in Household Comparison
Pakistanis
Immigrants from Burma/Myanmar
9.0%
NO VEHICLES IN HOUSEHOLD
98.3/ 100
METRIC RATING
101st/ 347
METRIC RANK
10.4%
NO VEHICLES IN HOUSEHOLD
49.1/ 100
METRIC RATING
175th/ 347
METRIC RANK
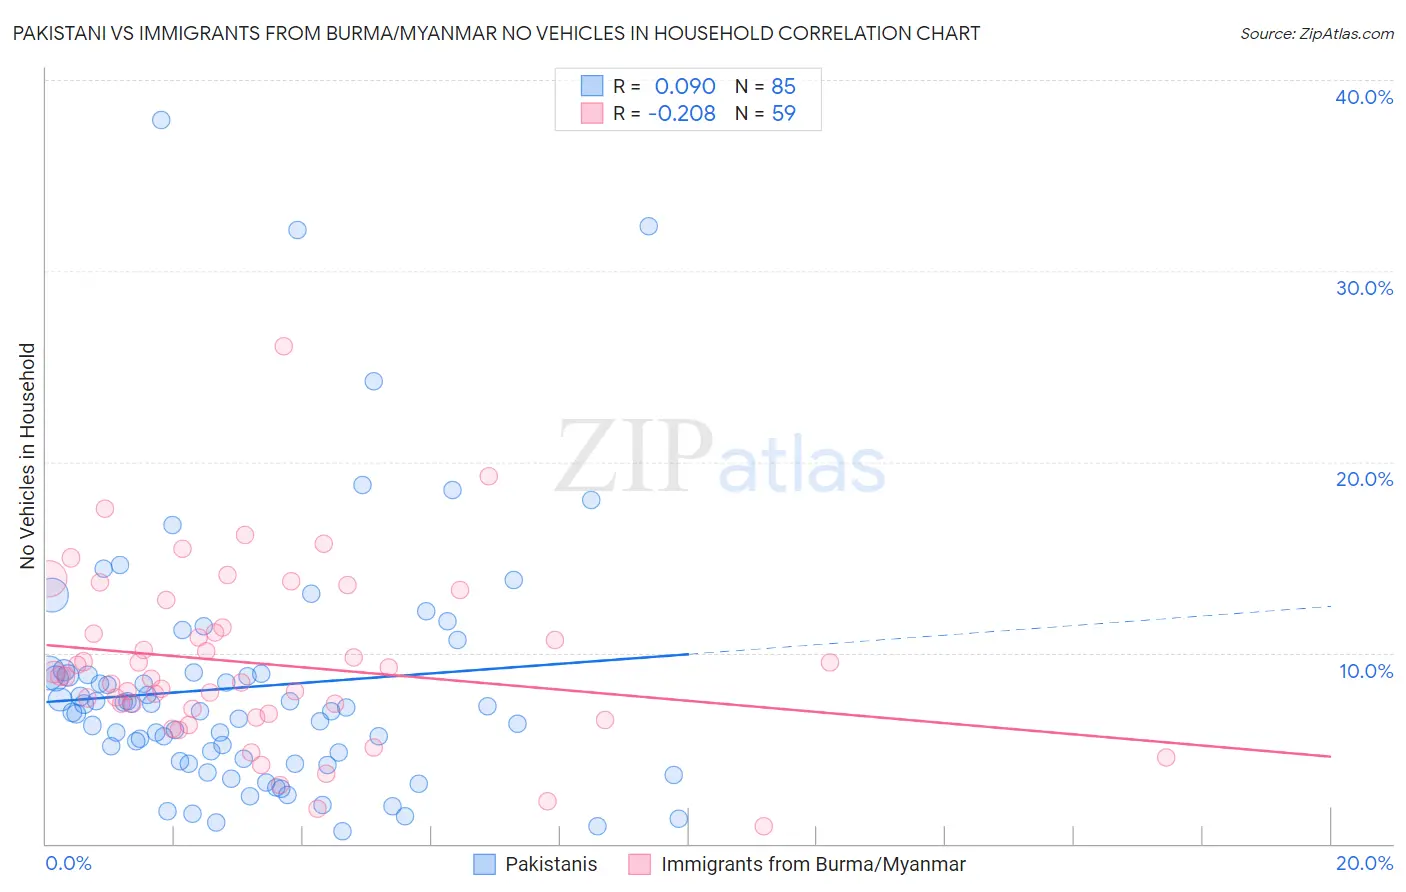
Pakistani vs Immigrants from Burma/Myanmar No Vehicles in Household Correlation Chart
The statistical analysis conducted on geographies consisting of 334,782,666 people shows a slight positive correlation between the proportion of Pakistanis and percentage of households with no vehicle available in the United States with a correlation coefficient (R) of 0.090 and weighted average of 9.0%. Similarly, the statistical analysis conducted on geographies consisting of 172,182,112 people shows a weak negative correlation between the proportion of Immigrants from Burma/Myanmar and percentage of households with no vehicle available in the United States with a correlation coefficient (R) of -0.208 and weighted average of 10.4%, a difference of 16.0%.
No Vehicles in Household Correlation Summary
| Measurement | Pakistani | Immigrants from Burma/Myanmar |
| Minimum | 0.66% | 0.91% |
| Maximum | 37.9% | 26.1% |
| Range | 37.2% | 25.1% |
| Mean | 8.2% | 9.4% |
| Median | 6.9% | 8.8% |
| Interquartile 25% (IQ1) | 4.3% | 6.8% |
| Interquartile 75% (IQ3) | 8.9% | 11.3% |
| Interquartile Range (IQR) | 4.7% | 4.6% |
| Standard Deviation (Sample) | 6.7% | 4.5% |
| Standard Deviation (Population) | 6.6% | 4.5% |
Similar Demographics by No Vehicles in Household
Demographics Similar to Pakistanis by No Vehicles in Household
In terms of no vehicles in household, the demographic groups most similar to Pakistanis are Asian (9.0%, a difference of 0.040%), Yugoslavian (9.0%, a difference of 0.050%), Seminole (9.0%, a difference of 0.050%), Bulgarian (9.0%, a difference of 0.22%), and Slavic (9.0%, a difference of 0.28%).
| Demographics | Rating | Rank | No Vehicles in Household |
| Austrians | 98.9 /100 | #94 | Exceptional 8.8% |
| Potawatomi | 98.8 /100 | #95 | Exceptional 8.8% |
| Immigrants | Bolivia | 98.7 /100 | #96 | Exceptional 8.9% |
| Immigrants | Central America | 98.5 /100 | #97 | Exceptional 8.9% |
| Slavs | 98.4 /100 | #98 | Exceptional 9.0% |
| Bulgarians | 98.4 /100 | #99 | Exceptional 9.0% |
| Asians | 98.3 /100 | #100 | Exceptional 9.0% |
| Pakistanis | 98.3 /100 | #101 | Exceptional 9.0% |
| Yugoslavians | 98.3 /100 | #102 | Exceptional 9.0% |
| Seminole | 98.3 /100 | #103 | Exceptional 9.0% |
| Zimbabweans | 98.0 /100 | #104 | Exceptional 9.0% |
| Spanish Americans | 97.9 /100 | #105 | Exceptional 9.1% |
| Laotians | 97.8 /100 | #106 | Exceptional 9.1% |
| Hispanics or Latinos | 97.7 /100 | #107 | Exceptional 9.1% |
| Mexican American Indians | 97.6 /100 | #108 | Exceptional 9.1% |
Demographics Similar to Immigrants from Burma/Myanmar by No Vehicles in Household
In terms of no vehicles in household, the demographic groups most similar to Immigrants from Burma/Myanmar are French American Indian (10.4%, a difference of 0.0%), Immigrants from El Salvador (10.4%, a difference of 0.010%), Immigrants from Sudan (10.4%, a difference of 0.12%), Filipino (10.4%, a difference of 0.13%), and Immigrants from Ethiopia (10.4%, a difference of 0.16%).
| Demographics | Rating | Rank | No Vehicles in Household |
| Indonesians | 56.7 /100 | #168 | Average 10.3% |
| Lumbee | 54.7 /100 | #169 | Average 10.3% |
| Immigrants | Latin America | 53.2 /100 | #170 | Average 10.4% |
| Hmong | 52.7 /100 | #171 | Average 10.4% |
| Brazilians | 51.7 /100 | #172 | Average 10.4% |
| Filipinos | 50.1 /100 | #173 | Average 10.4% |
| Immigrants | Sudan | 50.0 /100 | #174 | Average 10.4% |
| Immigrants | Burma/Myanmar | 49.1 /100 | #175 | Average 10.4% |
| French American Indians | 49.1 /100 | #176 | Average 10.4% |
| Immigrants | El Salvador | 49.1 /100 | #177 | Average 10.4% |
| Immigrants | Ethiopia | 48.0 /100 | #178 | Average 10.4% |
| Ethiopians | 45.8 /100 | #179 | Average 10.5% |
| Arabs | 45.3 /100 | #180 | Average 10.5% |
| Immigrants | Colombia | 44.1 /100 | #181 | Average 10.5% |
| Immigrants | Bulgaria | 43.8 /100 | #182 | Average 10.5% |