Puget Sound Salish vs Japanese No Vehicles in Household
COMPARE
Puget Sound Salish
Japanese
No Vehicles in Household
No Vehicles in Household Comparison
Puget Sound Salish
Japanese
9.5%
NO VEHICLES IN HOUSEHOLD
92.4/ 100
METRIC RATING
121st/ 347
METRIC RANK
9.4%
NO VEHICLES IN HOUSEHOLD
94.1/ 100
METRIC RATING
116th/ 347
METRIC RANK
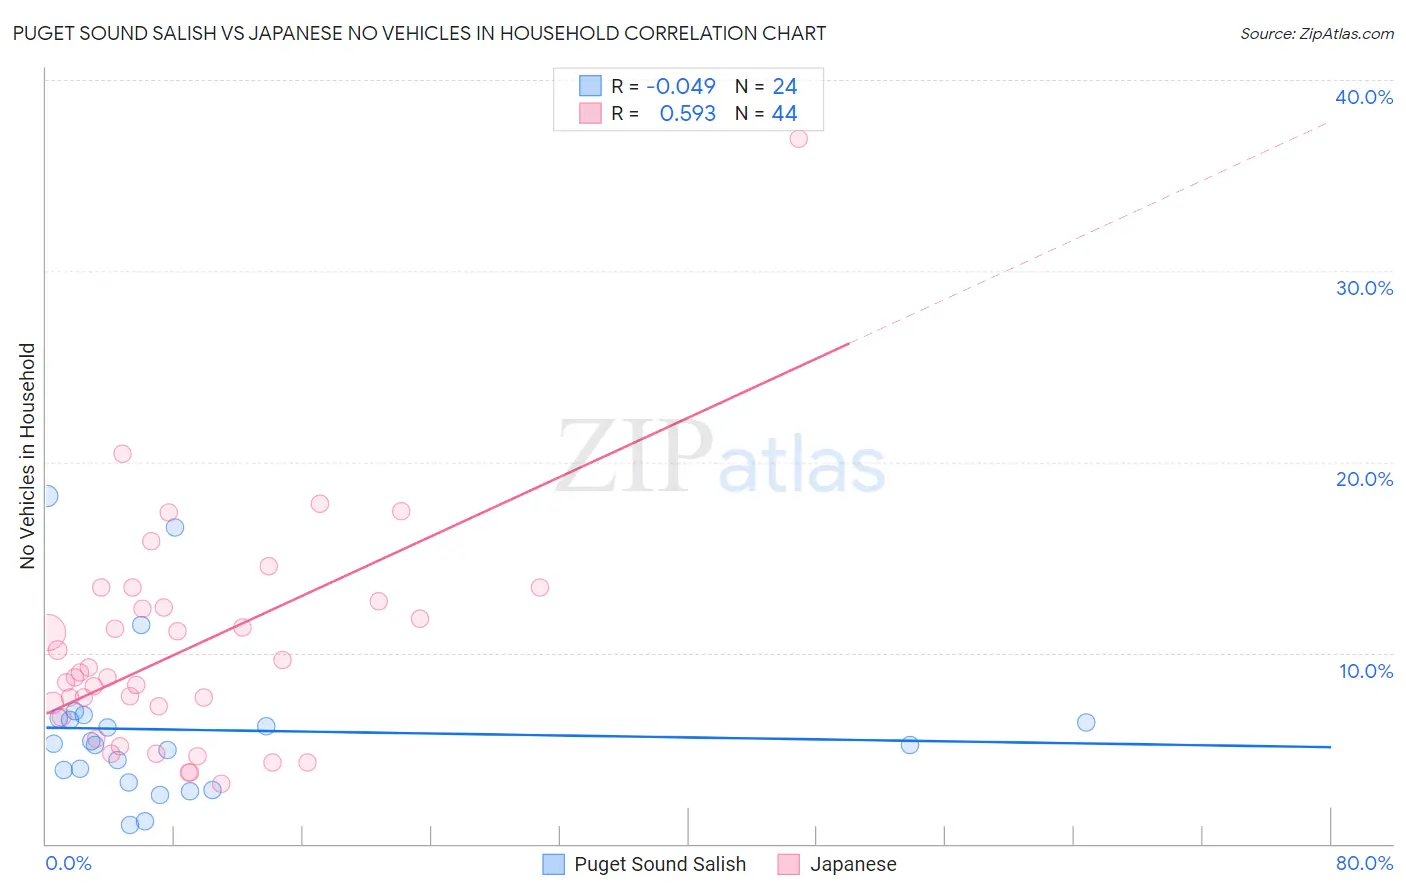
Puget Sound Salish vs Japanese No Vehicles in Household Correlation Chart
The statistical analysis conducted on geographies consisting of 46,140,231 people shows no correlation between the proportion of Puget Sound Salish and percentage of households with no vehicle available in the United States with a correlation coefficient (R) of -0.049 and weighted average of 9.5%. Similarly, the statistical analysis conducted on geographies consisting of 248,891,204 people shows a substantial positive correlation between the proportion of Japanese and percentage of households with no vehicle available in the United States with a correlation coefficient (R) of 0.593 and weighted average of 9.4%, a difference of 0.99%.
No Vehicles in Household Correlation Summary
| Measurement | Puget Sound Salish | Japanese |
| Minimum | 0.96% | 3.2% |
| Maximum | 18.2% | 36.9% |
| Range | 17.3% | 33.7% |
| Mean | 6.0% | 10.2% |
| Median | 5.2% | 8.9% |
| Interquartile 25% (IQ1) | 3.5% | 6.9% |
| Interquartile 75% (IQ3) | 6.5% | 12.6% |
| Interquartile Range (IQR) | 3.0% | 5.6% |
| Standard Deviation (Sample) | 4.2% | 5.9% |
| Standard Deviation (Population) | 4.1% | 5.8% |
Demographics Similar to Puget Sound Salish and Japanese by No Vehicles in Household
In terms of no vehicles in household, the demographic groups most similar to Puget Sound Salish are Costa Rican (9.5%, a difference of 0.050%), Immigrants from Thailand (9.5%, a difference of 0.10%), Fijian (9.5%, a difference of 0.16%), Greek (9.5%, a difference of 0.27%), and Blackfeet (9.6%, a difference of 0.51%). Similarly, the demographic groups most similar to Japanese are Navajo (9.4%, a difference of 0.070%), Serbian (9.4%, a difference of 0.13%), Chippewa (9.4%, a difference of 0.17%), Immigrants from Netherlands (9.4%, a difference of 0.56%), and Armenian (9.4%, a difference of 0.66%).
| Demographics | Rating | Rank | No Vehicles in Household |
| Mexican American Indians | 97.6 /100 | #108 | Exceptional 9.1% |
| Maltese | 97.6 /100 | #109 | Exceptional 9.1% |
| Delaware | 97.2 /100 | #110 | Exceptional 9.2% |
| Immigrants | Kuwait | 95.1 /100 | #111 | Exceptional 9.4% |
| Armenians | 95.0 /100 | #112 | Exceptional 9.4% |
| Immigrants | Netherlands | 94.8 /100 | #113 | Exceptional 9.4% |
| Serbians | 94.3 /100 | #114 | Exceptional 9.4% |
| Navajo | 94.2 /100 | #115 | Exceptional 9.4% |
| Japanese | 94.1 /100 | #116 | Exceptional 9.4% |
| Chippewa | 93.8 /100 | #117 | Exceptional 9.4% |
| Greeks | 92.9 /100 | #118 | Exceptional 9.5% |
| Fijians | 92.7 /100 | #119 | Exceptional 9.5% |
| Immigrants | Thailand | 92.6 /100 | #120 | Exceptional 9.5% |
| Puget Sound Salish | 92.4 /100 | #121 | Exceptional 9.5% |
| Costa Ricans | 92.3 /100 | #122 | Exceptional 9.5% |
| Blackfeet | 91.4 /100 | #123 | Exceptional 9.6% |
| Immigrants | Korea | 90.9 /100 | #124 | Exceptional 9.6% |
| Immigrants | Cameroon | 90.6 /100 | #125 | Exceptional 9.6% |
| Icelanders | 90.2 /100 | #126 | Exceptional 9.6% |
| Immigrants | Kenya | 89.7 /100 | #127 | Excellent 9.6% |
| Immigrants | Syria | 89.5 /100 | #128 | Excellent 9.6% |