Puget Sound Salish vs Cheyenne No Vehicles in Household
COMPARE
Puget Sound Salish
Cheyenne
No Vehicles in Household
No Vehicles in Household Comparison
Puget Sound Salish
Cheyenne
9.5%
NO VEHICLES IN HOUSEHOLD
92.4/ 100
METRIC RATING
121st/ 347
METRIC RANK
11.7%
NO VEHICLES IN HOUSEHOLD
2.4/ 100
METRIC RATING
243rd/ 347
METRIC RANK
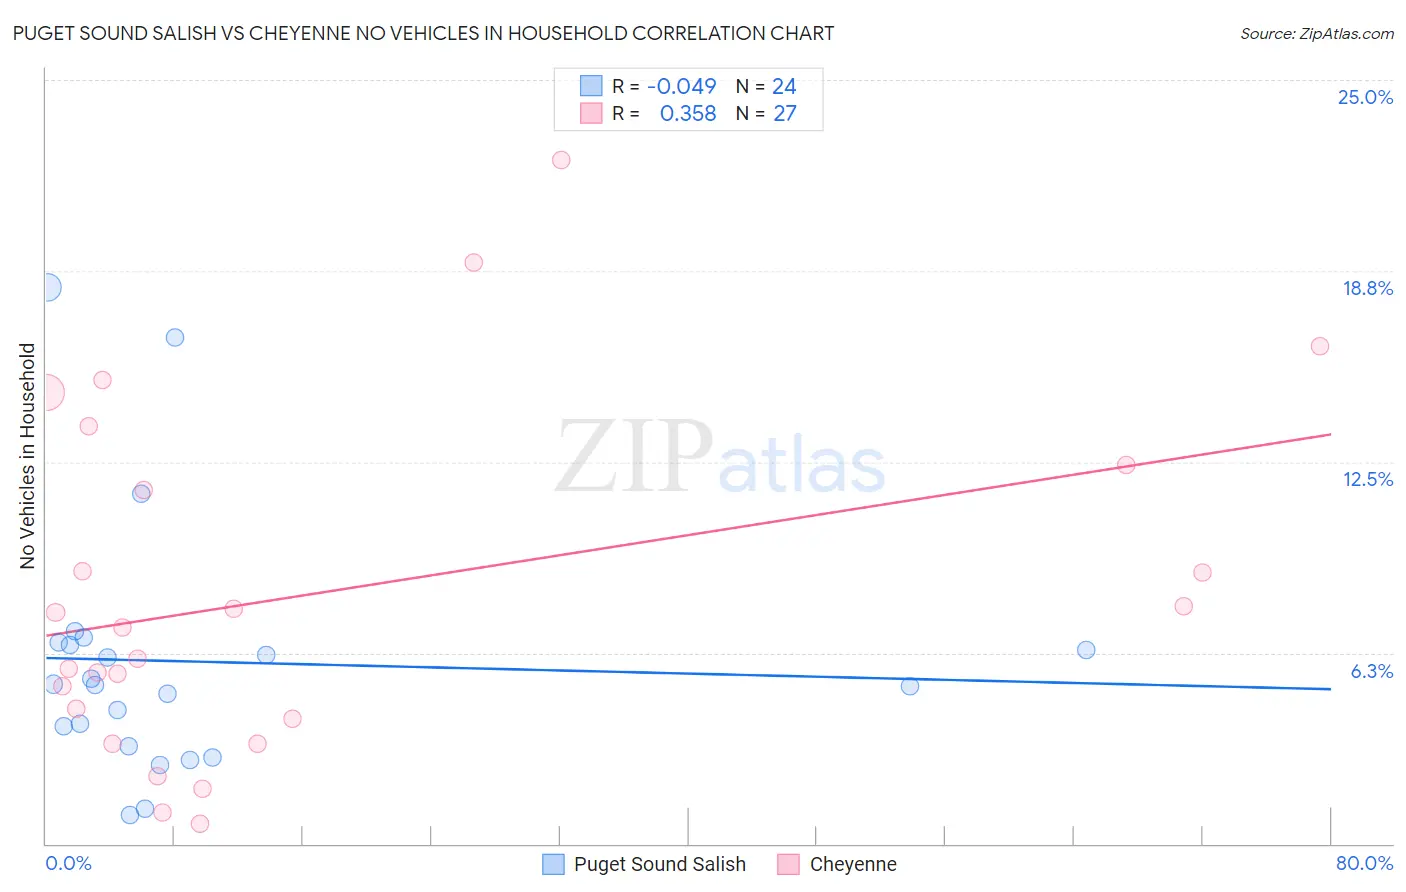
Puget Sound Salish vs Cheyenne No Vehicles in Household Correlation Chart
The statistical analysis conducted on geographies consisting of 46,140,231 people shows no correlation between the proportion of Puget Sound Salish and percentage of households with no vehicle available in the United States with a correlation coefficient (R) of -0.049 and weighted average of 9.5%. Similarly, the statistical analysis conducted on geographies consisting of 80,645,180 people shows a mild positive correlation between the proportion of Cheyenne and percentage of households with no vehicle available in the United States with a correlation coefficient (R) of 0.358 and weighted average of 11.7%, a difference of 23.0%.
No Vehicles in Household Correlation Summary
| Measurement | Puget Sound Salish | Cheyenne |
| Minimum | 0.96% | 0.64% |
| Maximum | 18.2% | 22.4% |
| Range | 17.3% | 21.7% |
| Mean | 6.0% | 8.2% |
| Median | 5.2% | 7.1% |
| Interquartile 25% (IQ1) | 3.5% | 4.1% |
| Interquartile 75% (IQ3) | 6.5% | 12.4% |
| Interquartile Range (IQR) | 3.0% | 8.3% |
| Standard Deviation (Sample) | 4.2% | 5.7% |
| Standard Deviation (Population) | 4.1% | 5.6% |
Similar Demographics by No Vehicles in Household
Demographics Similar to Puget Sound Salish by No Vehicles in Household
In terms of no vehicles in household, the demographic groups most similar to Puget Sound Salish are Costa Rican (9.5%, a difference of 0.050%), Immigrants from Thailand (9.5%, a difference of 0.10%), Fijian (9.5%, a difference of 0.16%), Greek (9.5%, a difference of 0.27%), and Blackfeet (9.6%, a difference of 0.51%).
| Demographics | Rating | Rank | No Vehicles in Household |
| Serbians | 94.3 /100 | #114 | Exceptional 9.4% |
| Navajo | 94.2 /100 | #115 | Exceptional 9.4% |
| Japanese | 94.1 /100 | #116 | Exceptional 9.4% |
| Chippewa | 93.8 /100 | #117 | Exceptional 9.4% |
| Greeks | 92.9 /100 | #118 | Exceptional 9.5% |
| Fijians | 92.7 /100 | #119 | Exceptional 9.5% |
| Immigrants | Thailand | 92.6 /100 | #120 | Exceptional 9.5% |
| Puget Sound Salish | 92.4 /100 | #121 | Exceptional 9.5% |
| Costa Ricans | 92.3 /100 | #122 | Exceptional 9.5% |
| Blackfeet | 91.4 /100 | #123 | Exceptional 9.6% |
| Immigrants | Korea | 90.9 /100 | #124 | Exceptional 9.6% |
| Immigrants | Cameroon | 90.6 /100 | #125 | Exceptional 9.6% |
| Icelanders | 90.2 /100 | #126 | Exceptional 9.6% |
| Immigrants | Kenya | 89.7 /100 | #127 | Excellent 9.6% |
| Immigrants | Syria | 89.5 /100 | #128 | Excellent 9.6% |
Demographics Similar to Cheyenne by No Vehicles in Household
In terms of no vehicles in household, the demographic groups most similar to Cheyenne are Immigrants from Portugal (11.7%, a difference of 0.18%), Turkish (11.7%, a difference of 0.33%), Immigrants from Honduras (11.8%, a difference of 0.37%), Eastern European (11.7%, a difference of 0.44%), and Immigrants (11.7%, a difference of 0.45%).
| Demographics | Rating | Rank | No Vehicles in Household |
| Cree | 3.5 /100 | #236 | Tragic 11.6% |
| Ute | 3.3 /100 | #237 | Tragic 11.6% |
| Russians | 3.2 /100 | #238 | Tragic 11.6% |
| Taiwanese | 2.8 /100 | #239 | Tragic 11.7% |
| Immigrants | Immigrants | 2.7 /100 | #240 | Tragic 11.7% |
| Eastern Europeans | 2.7 /100 | #241 | Tragic 11.7% |
| Turks | 2.6 /100 | #242 | Tragic 11.7% |
| Cheyenne | 2.4 /100 | #243 | Tragic 11.7% |
| Immigrants | Portugal | 2.2 /100 | #244 | Tragic 11.7% |
| Immigrants | Honduras | 2.1 /100 | #245 | Tragic 11.8% |
| Menominee | 2.0 /100 | #246 | Tragic 11.8% |
| Immigrants | Czechoslovakia | 2.0 /100 | #247 | Tragic 11.8% |
| Immigrants | Belgium | 1.9 /100 | #248 | Tragic 11.8% |
| Immigrants | Nigeria | 1.9 /100 | #249 | Tragic 11.8% |
| Paiute | 1.8 /100 | #250 | Tragic 11.8% |