Yup'ik vs Immigrants from Burma/Myanmar No Vehicles in Household
COMPARE
Yup'ik
Immigrants from Burma/Myanmar
No Vehicles in Household
No Vehicles in Household Comparison
Yup'ik
Immigrants from Burma/Myanmar
45.9%
NO VEHICLES IN HOUSEHOLD
0.0/ 100
METRIC RATING
347th/ 347
METRIC RANK
10.4%
NO VEHICLES IN HOUSEHOLD
49.1/ 100
METRIC RATING
175th/ 347
METRIC RANK
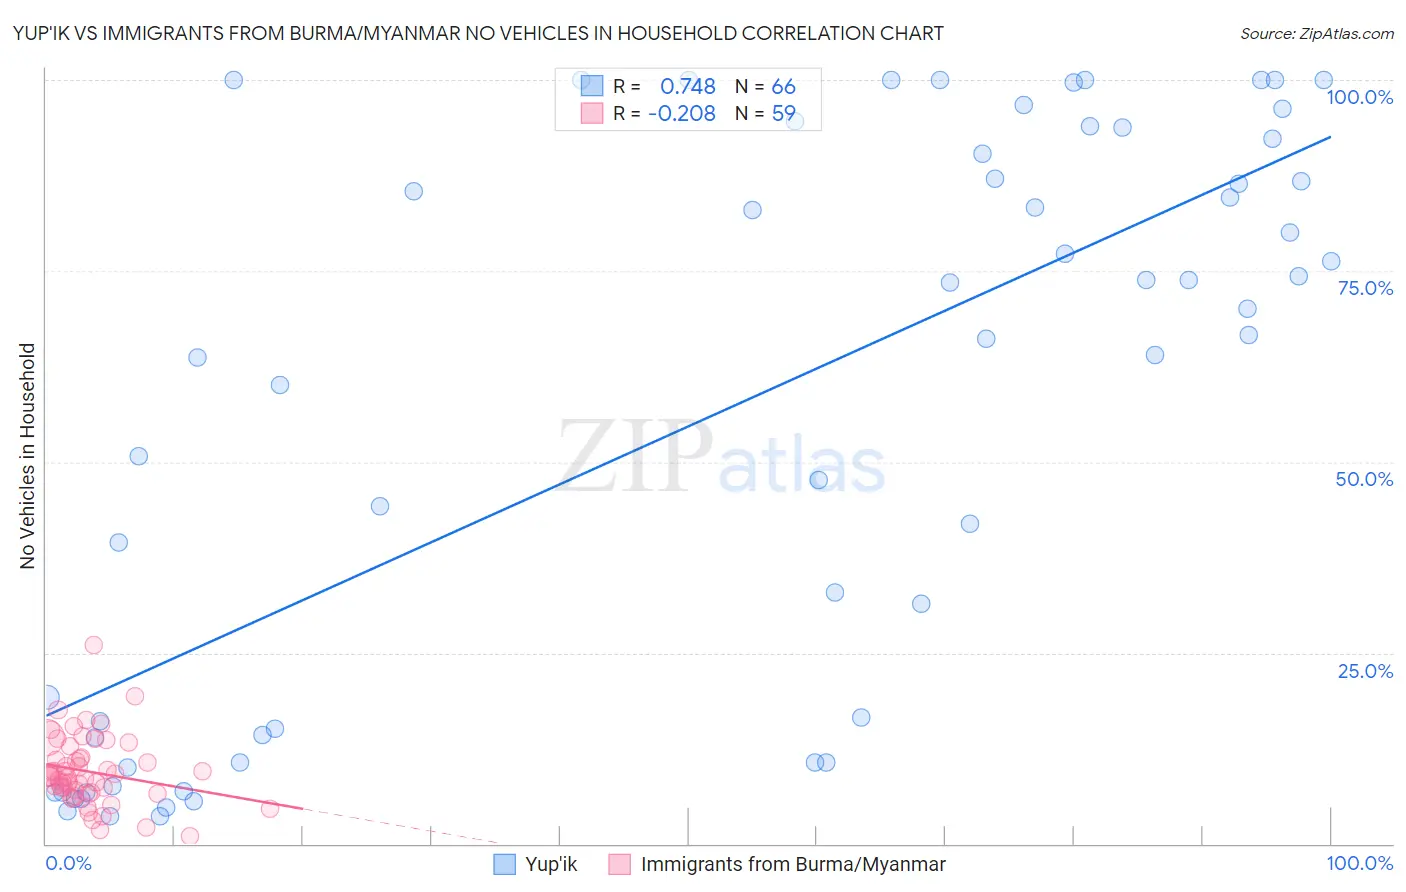
Yup'ik vs Immigrants from Burma/Myanmar No Vehicles in Household Correlation Chart
The statistical analysis conducted on geographies consisting of 39,930,704 people shows a strong positive correlation between the proportion of Yup'ik and percentage of households with no vehicle available in the United States with a correlation coefficient (R) of 0.748 and weighted average of 45.9%. Similarly, the statistical analysis conducted on geographies consisting of 172,182,112 people shows a weak negative correlation between the proportion of Immigrants from Burma/Myanmar and percentage of households with no vehicle available in the United States with a correlation coefficient (R) of -0.208 and weighted average of 10.4%, a difference of 340.5%.
No Vehicles in Household Correlation Summary
| Measurement | Yup'ik | Immigrants from Burma/Myanmar |
| Minimum | 3.5% | 0.91% |
| Maximum | 100.0% | 26.1% |
| Range | 96.5% | 25.1% |
| Mean | 55.6% | 9.4% |
| Median | 66.4% | 8.8% |
| Interquartile 25% (IQ1) | 14.0% | 6.8% |
| Interquartile 75% (IQ3) | 90.4% | 11.3% |
| Interquartile Range (IQR) | 76.4% | 4.6% |
| Standard Deviation (Sample) | 37.0% | 4.5% |
| Standard Deviation (Population) | 36.7% | 4.5% |
Similar Demographics by No Vehicles in Household
Demographics Similar to Yup'ik by No Vehicles in Household
In terms of no vehicles in household, the demographic groups most similar to Yup'ik are Immigrants from Grenada (37.5%, a difference of 22.5%), Immigrants from St. Vincent and the Grenadines (35.4%, a difference of 29.6%), Immigrants from Dominican Republic (31.4%, a difference of 46.0%), Inupiat (29.9%, a difference of 53.6%), and British West Indian (29.7%, a difference of 54.3%).
| Demographics | Rating | Rank | No Vehicles in Household |
| Immigrants | Trinidad and Tobago | 0.0 /100 | #333 | Tragic 24.6% |
| Immigrants | Bangladesh | 0.0 /100 | #334 | Tragic 25.8% |
| Barbadians | 0.0 /100 | #335 | Tragic 26.1% |
| Vietnamese | 0.0 /100 | #336 | Tragic 26.2% |
| Immigrants | Uzbekistan | 0.0 /100 | #337 | Tragic 26.7% |
| Guyanese | 0.0 /100 | #338 | Tragic 29.3% |
| Dominicans | 0.0 /100 | #339 | Tragic 29.4% |
| Immigrants | Barbados | 0.0 /100 | #340 | Tragic 29.5% |
| Immigrants | Guyana | 0.0 /100 | #341 | Tragic 29.5% |
| British West Indians | 0.0 /100 | #342 | Tragic 29.7% |
| Inupiat | 0.0 /100 | #343 | Tragic 29.9% |
| Immigrants | Dominican Republic | 0.0 /100 | #344 | Tragic 31.4% |
| Immigrants | St. Vincent and the Grenadines | 0.0 /100 | #345 | Tragic 35.4% |
| Immigrants | Grenada | 0.0 /100 | #346 | Tragic 37.5% |
| Yup'ik | 0.0 /100 | #347 | Tragic 45.9% |
Demographics Similar to Immigrants from Burma/Myanmar by No Vehicles in Household
In terms of no vehicles in household, the demographic groups most similar to Immigrants from Burma/Myanmar are French American Indian (10.4%, a difference of 0.0%), Immigrants from El Salvador (10.4%, a difference of 0.010%), Immigrants from Sudan (10.4%, a difference of 0.12%), Filipino (10.4%, a difference of 0.13%), and Immigrants from Ethiopia (10.4%, a difference of 0.16%).
| Demographics | Rating | Rank | No Vehicles in Household |
| Indonesians | 56.7 /100 | #168 | Average 10.3% |
| Lumbee | 54.7 /100 | #169 | Average 10.3% |
| Immigrants | Latin America | 53.2 /100 | #170 | Average 10.4% |
| Hmong | 52.7 /100 | #171 | Average 10.4% |
| Brazilians | 51.7 /100 | #172 | Average 10.4% |
| Filipinos | 50.1 /100 | #173 | Average 10.4% |
| Immigrants | Sudan | 50.0 /100 | #174 | Average 10.4% |
| Immigrants | Burma/Myanmar | 49.1 /100 | #175 | Average 10.4% |
| French American Indians | 49.1 /100 | #176 | Average 10.4% |
| Immigrants | El Salvador | 49.1 /100 | #177 | Average 10.4% |
| Immigrants | Ethiopia | 48.0 /100 | #178 | Average 10.4% |
| Ethiopians | 45.8 /100 | #179 | Average 10.5% |
| Arabs | 45.3 /100 | #180 | Average 10.5% |
| Immigrants | Colombia | 44.1 /100 | #181 | Average 10.5% |
| Immigrants | Bulgaria | 43.8 /100 | #182 | Average 10.5% |