Puget Sound Salish vs Hopi No Vehicles in Household
COMPARE
Puget Sound Salish
Hopi
No Vehicles in Household
No Vehicles in Household Comparison
Puget Sound Salish
Hopi
9.5%
NO VEHICLES IN HOUSEHOLD
92.4/ 100
METRIC RATING
121st/ 347
METRIC RANK
13.7%
NO VEHICLES IN HOUSEHOLD
0.0/ 100
METRIC RATING
288th/ 347
METRIC RANK
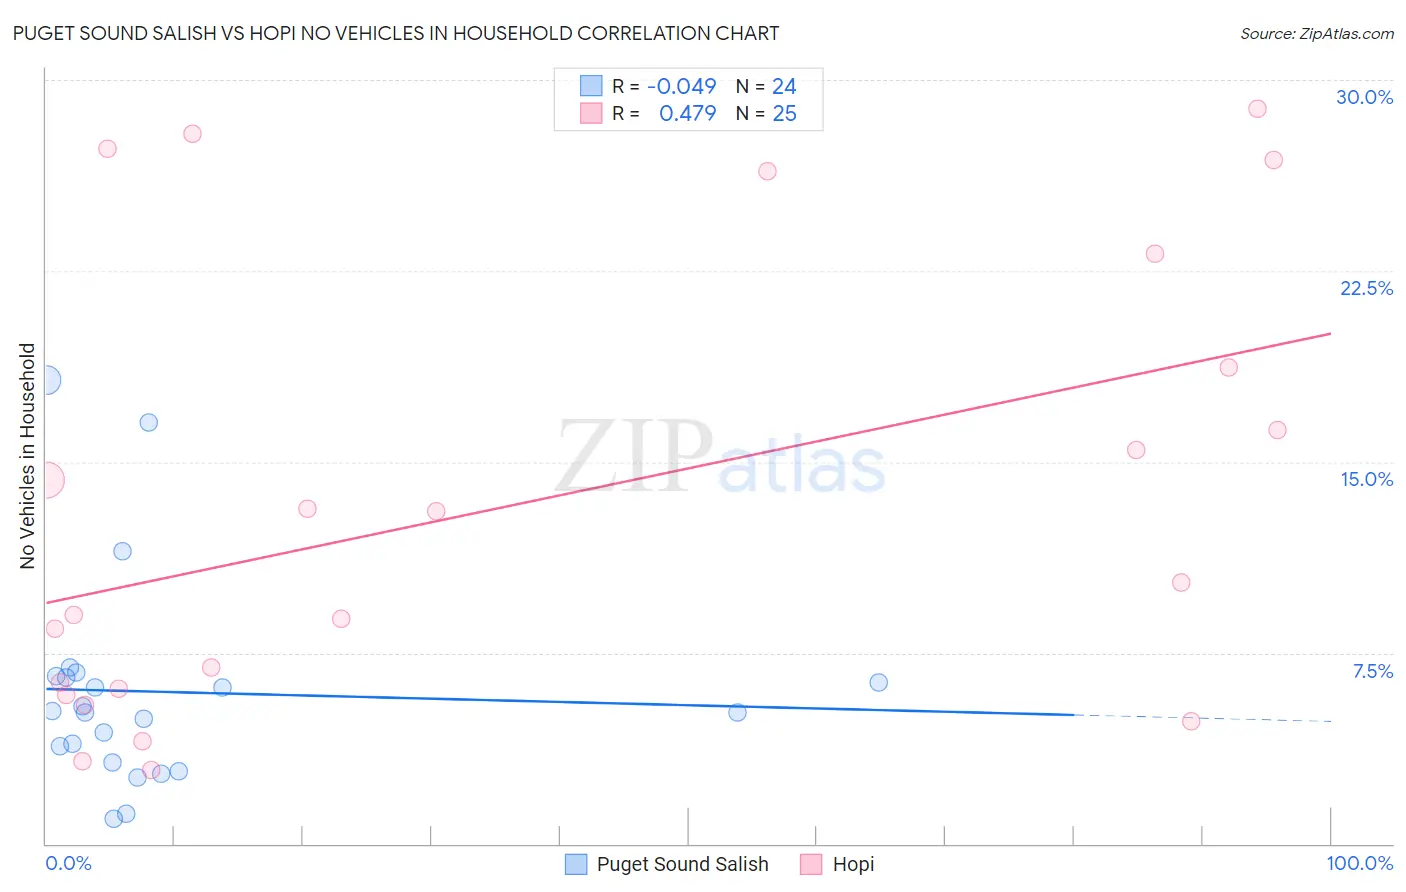
Puget Sound Salish vs Hopi No Vehicles in Household Correlation Chart
The statistical analysis conducted on geographies consisting of 46,140,231 people shows no correlation between the proportion of Puget Sound Salish and percentage of households with no vehicle available in the United States with a correlation coefficient (R) of -0.049 and weighted average of 9.5%. Similarly, the statistical analysis conducted on geographies consisting of 74,700,452 people shows a moderate positive correlation between the proportion of Hopi and percentage of households with no vehicle available in the United States with a correlation coefficient (R) of 0.479 and weighted average of 13.7%, a difference of 44.2%.
No Vehicles in Household Correlation Summary
| Measurement | Puget Sound Salish | Hopi |
| Minimum | 0.96% | 2.9% |
| Maximum | 18.2% | 28.9% |
| Range | 17.3% | 26.0% |
| Mean | 6.0% | 13.3% |
| Median | 5.2% | 10.2% |
| Interquartile 25% (IQ1) | 3.5% | 5.9% |
| Interquartile 75% (IQ3) | 6.5% | 20.9% |
| Interquartile Range (IQR) | 3.0% | 15.0% |
| Standard Deviation (Sample) | 4.2% | 8.8% |
| Standard Deviation (Population) | 4.1% | 8.6% |
Similar Demographics by No Vehicles in Household
Demographics Similar to Puget Sound Salish by No Vehicles in Household
In terms of no vehicles in household, the demographic groups most similar to Puget Sound Salish are Costa Rican (9.5%, a difference of 0.050%), Immigrants from Thailand (9.5%, a difference of 0.10%), Fijian (9.5%, a difference of 0.16%), Greek (9.5%, a difference of 0.27%), and Blackfeet (9.6%, a difference of 0.51%).
| Demographics | Rating | Rank | No Vehicles in Household |
| Serbians | 94.3 /100 | #114 | Exceptional 9.4% |
| Navajo | 94.2 /100 | #115 | Exceptional 9.4% |
| Japanese | 94.1 /100 | #116 | Exceptional 9.4% |
| Chippewa | 93.8 /100 | #117 | Exceptional 9.4% |
| Greeks | 92.9 /100 | #118 | Exceptional 9.5% |
| Fijians | 92.7 /100 | #119 | Exceptional 9.5% |
| Immigrants | Thailand | 92.6 /100 | #120 | Exceptional 9.5% |
| Puget Sound Salish | 92.4 /100 | #121 | Exceptional 9.5% |
| Costa Ricans | 92.3 /100 | #122 | Exceptional 9.5% |
| Blackfeet | 91.4 /100 | #123 | Exceptional 9.6% |
| Immigrants | Korea | 90.9 /100 | #124 | Exceptional 9.6% |
| Immigrants | Cameroon | 90.6 /100 | #125 | Exceptional 9.6% |
| Icelanders | 90.2 /100 | #126 | Exceptional 9.6% |
| Immigrants | Kenya | 89.7 /100 | #127 | Excellent 9.6% |
| Immigrants | Syria | 89.5 /100 | #128 | Excellent 9.6% |
Demographics Similar to Hopi by No Vehicles in Household
In terms of no vehicles in household, the demographic groups most similar to Hopi are Immigrants from Ireland (13.7%, a difference of 0.13%), Colville (13.7%, a difference of 0.35%), Immigrants from Australia (13.8%, a difference of 0.66%), Immigrants from Eastern Europe (13.6%, a difference of 1.0%), and Immigrants from Malaysia (13.6%, a difference of 1.1%).
| Demographics | Rating | Rank | No Vehicles in Household |
| Central American Indians | 0.0 /100 | #281 | Tragic 13.3% |
| Immigrants | Eastern Asia | 0.0 /100 | #282 | Tragic 13.5% |
| Immigrants | Kazakhstan | 0.0 /100 | #283 | Tragic 13.6% |
| Immigrants | Malaysia | 0.0 /100 | #284 | Tragic 13.6% |
| Immigrants | Eastern Europe | 0.0 /100 | #285 | Tragic 13.6% |
| Colville | 0.0 /100 | #286 | Tragic 13.7% |
| Immigrants | Ireland | 0.0 /100 | #287 | Tragic 13.7% |
| Hopi | 0.0 /100 | #288 | Tragic 13.7% |
| Immigrants | Australia | 0.0 /100 | #289 | Tragic 13.8% |
| Indians (Asian) | 0.0 /100 | #290 | Tragic 14.1% |
| Okinawans | 0.0 /100 | #291 | Tragic 14.1% |
| Pima | 0.0 /100 | #292 | Tragic 14.1% |
| Immigrants | Jamaica | 0.0 /100 | #293 | Tragic 14.2% |
| Belizeans | 0.0 /100 | #294 | Tragic 14.3% |
| Paraguayans | 0.0 /100 | #295 | Tragic 14.4% |