Puget Sound Salish vs Immigrants from Northern Europe No Vehicles in Household
COMPARE
Puget Sound Salish
Immigrants from Northern Europe
No Vehicles in Household
No Vehicles in Household Comparison
Puget Sound Salish
Immigrants from Northern Europe
9.5%
NO VEHICLES IN HOUSEHOLD
92.4/ 100
METRIC RATING
121st/ 347
METRIC RANK
10.7%
NO VEHICLES IN HOUSEHOLD
33.1/ 100
METRIC RATING
191st/ 347
METRIC RANK
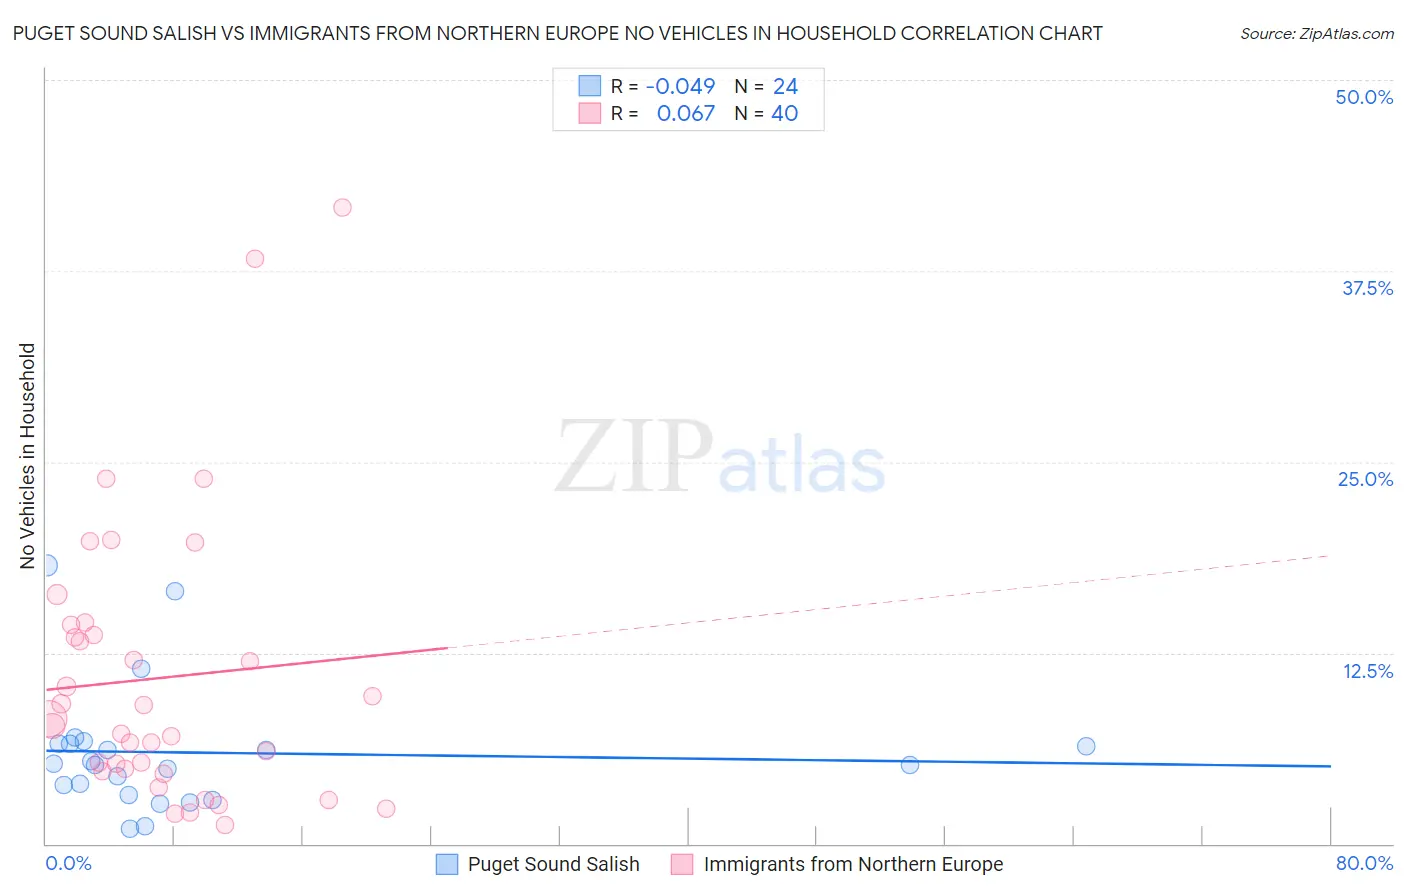
Puget Sound Salish vs Immigrants from Northern Europe No Vehicles in Household Correlation Chart
The statistical analysis conducted on geographies consisting of 46,140,231 people shows no correlation between the proportion of Puget Sound Salish and percentage of households with no vehicle available in the United States with a correlation coefficient (R) of -0.049 and weighted average of 9.5%. Similarly, the statistical analysis conducted on geographies consisting of 475,076,775 people shows a slight positive correlation between the proportion of Immigrants from Northern Europe and percentage of households with no vehicle available in the United States with a correlation coefficient (R) of 0.067 and weighted average of 10.7%, a difference of 11.8%.
No Vehicles in Household Correlation Summary
| Measurement | Puget Sound Salish | Immigrants from Northern Europe |
| Minimum | 0.96% | 1.2% |
| Maximum | 18.2% | 41.7% |
| Range | 17.3% | 40.4% |
| Mean | 6.0% | 10.8% |
| Median | 5.2% | 7.9% |
| Interquartile 25% (IQ1) | 3.5% | 4.8% |
| Interquartile 75% (IQ3) | 6.5% | 14.0% |
| Interquartile Range (IQR) | 3.0% | 9.2% |
| Standard Deviation (Sample) | 4.2% | 9.1% |
| Standard Deviation (Population) | 4.1% | 9.0% |
Similar Demographics by No Vehicles in Household
Demographics Similar to Puget Sound Salish by No Vehicles in Household
In terms of no vehicles in household, the demographic groups most similar to Puget Sound Salish are Costa Rican (9.5%, a difference of 0.050%), Immigrants from Thailand (9.5%, a difference of 0.10%), Fijian (9.5%, a difference of 0.16%), Greek (9.5%, a difference of 0.27%), and Blackfeet (9.6%, a difference of 0.51%).
| Demographics | Rating | Rank | No Vehicles in Household |
| Serbians | 94.3 /100 | #114 | Exceptional 9.4% |
| Navajo | 94.2 /100 | #115 | Exceptional 9.4% |
| Japanese | 94.1 /100 | #116 | Exceptional 9.4% |
| Chippewa | 93.8 /100 | #117 | Exceptional 9.4% |
| Greeks | 92.9 /100 | #118 | Exceptional 9.5% |
| Fijians | 92.7 /100 | #119 | Exceptional 9.5% |
| Immigrants | Thailand | 92.6 /100 | #120 | Exceptional 9.5% |
| Puget Sound Salish | 92.4 /100 | #121 | Exceptional 9.5% |
| Costa Ricans | 92.3 /100 | #122 | Exceptional 9.5% |
| Blackfeet | 91.4 /100 | #123 | Exceptional 9.6% |
| Immigrants | Korea | 90.9 /100 | #124 | Exceptional 9.6% |
| Immigrants | Cameroon | 90.6 /100 | #125 | Exceptional 9.6% |
| Icelanders | 90.2 /100 | #126 | Exceptional 9.6% |
| Immigrants | Kenya | 89.7 /100 | #127 | Excellent 9.6% |
| Immigrants | Syria | 89.5 /100 | #128 | Excellent 9.6% |
Demographics Similar to Immigrants from Northern Europe by No Vehicles in Household
In terms of no vehicles in household, the demographic groups most similar to Immigrants from Northern Europe are Carpatho Rusyn (10.7%, a difference of 0.14%), Immigrants from North Macedonia (10.6%, a difference of 0.23%), Immigrants from Eritrea (10.6%, a difference of 0.47%), Immigrants from Armenia (10.6%, a difference of 0.65%), and Immigrants from Poland (10.6%, a difference of 0.77%).
| Demographics | Rating | Rank | No Vehicles in Household |
| Immigrants | Nepal | 42.4 /100 | #184 | Average 10.5% |
| South Americans | 41.9 /100 | #185 | Average 10.5% |
| German Russians | 40.6 /100 | #186 | Average 10.5% |
| Immigrants | Poland | 38.4 /100 | #187 | Fair 10.6% |
| Immigrants | Armenia | 37.5 /100 | #188 | Fair 10.6% |
| Immigrants | Eritrea | 36.3 /100 | #189 | Fair 10.6% |
| Immigrants | North Macedonia | 34.6 /100 | #190 | Fair 10.6% |
| Immigrants | Northern Europe | 33.1 /100 | #191 | Fair 10.7% |
| Carpatho Rusyns | 32.1 /100 | #192 | Fair 10.7% |
| Ukrainians | 28.0 /100 | #193 | Fair 10.7% |
| Pueblo | 27.0 /100 | #194 | Fair 10.8% |
| Immigrants | Brazil | 26.3 /100 | #195 | Fair 10.8% |
| Central Americans | 24.3 /100 | #196 | Fair 10.8% |
| Shoshone | 24.1 /100 | #197 | Fair 10.8% |
| Immigrants | Sweden | 22.9 /100 | #198 | Fair 10.8% |