Puget Sound Salish vs Immigrants from Lithuania No Vehicles in Household
COMPARE
Puget Sound Salish
Immigrants from Lithuania
No Vehicles in Household
No Vehicles in Household Comparison
Puget Sound Salish
Immigrants from Lithuania
9.5%
NO VEHICLES IN HOUSEHOLD
92.4/ 100
METRIC RATING
121st/ 347
METRIC RANK
9.8%
NO VEHICLES IN HOUSEHOLD
84.0/ 100
METRIC RATING
140th/ 347
METRIC RANK
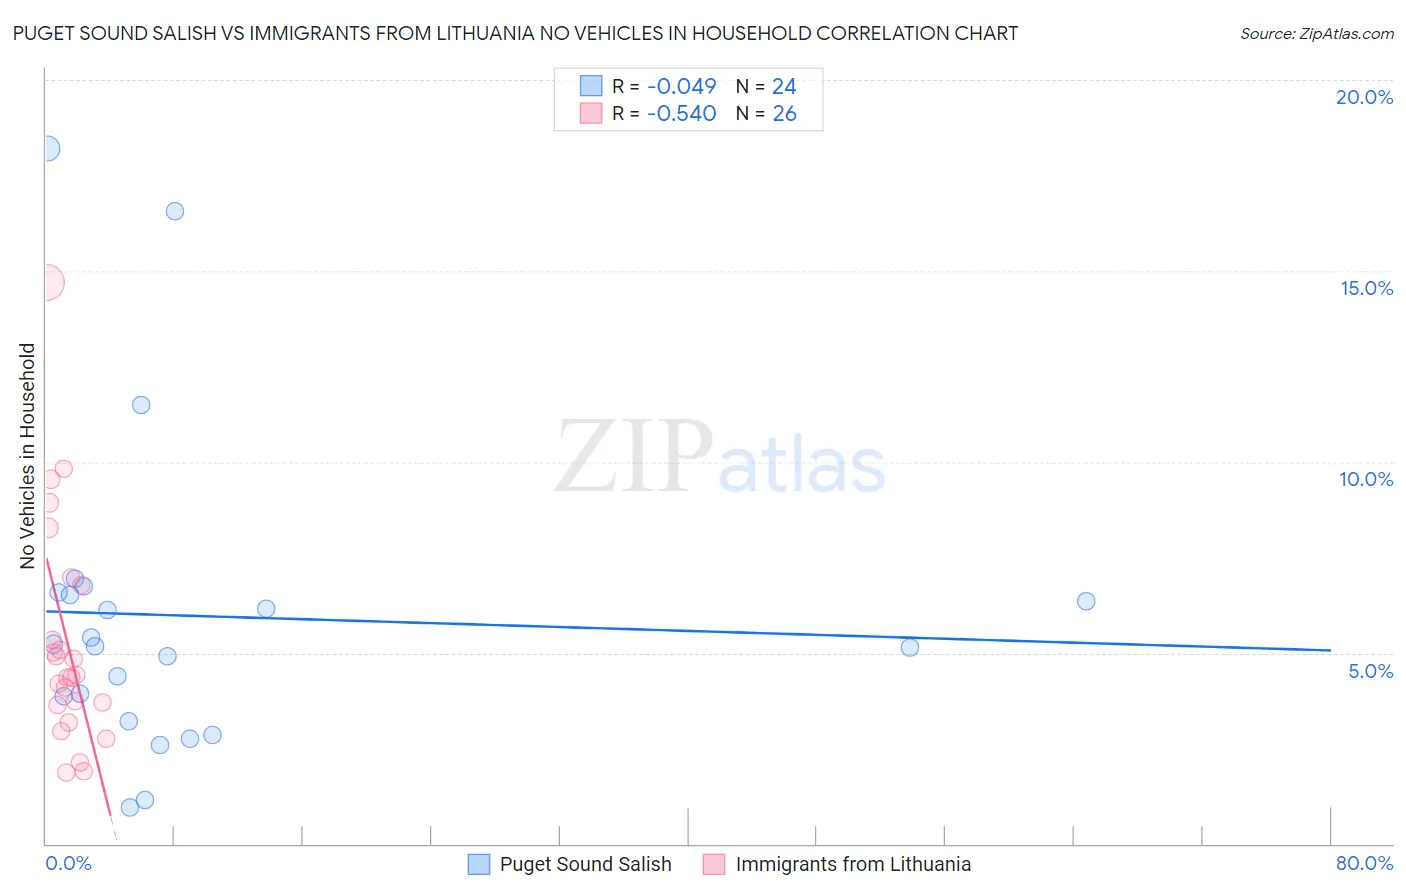
Puget Sound Salish vs Immigrants from Lithuania No Vehicles in Household Correlation Chart
The statistical analysis conducted on geographies consisting of 46,140,231 people shows no correlation between the proportion of Puget Sound Salish and percentage of households with no vehicle available in the United States with a correlation coefficient (R) of -0.049 and weighted average of 9.5%. Similarly, the statistical analysis conducted on geographies consisting of 117,637,222 people shows a substantial negative correlation between the proportion of Immigrants from Lithuania and percentage of households with no vehicle available in the United States with a correlation coefficient (R) of -0.540 and weighted average of 9.8%, a difference of 3.1%.
No Vehicles in Household Correlation Summary
| Measurement | Puget Sound Salish | Immigrants from Lithuania |
| Minimum | 0.96% | 1.9% |
| Maximum | 18.2% | 14.7% |
| Range | 17.3% | 12.8% |
| Mean | 6.0% | 5.3% |
| Median | 5.2% | 4.4% |
| Interquartile 25% (IQ1) | 3.5% | 3.6% |
| Interquartile 75% (IQ3) | 6.5% | 6.8% |
| Interquartile Range (IQR) | 3.0% | 3.1% |
| Standard Deviation (Sample) | 4.2% | 2.9% |
| Standard Deviation (Population) | 4.1% | 2.9% |
Demographics Similar to Puget Sound Salish and Immigrants from Lithuania by No Vehicles in Household
In terms of no vehicles in household, the demographic groups most similar to Puget Sound Salish are Costa Rican (9.5%, a difference of 0.050%), Immigrants from Thailand (9.5%, a difference of 0.10%), Blackfeet (9.6%, a difference of 0.51%), Immigrants from Korea (9.6%, a difference of 0.73%), and Immigrants from Cameroon (9.6%, a difference of 0.86%). Similarly, the demographic groups most similar to Immigrants from Lithuania are Marshallese (9.8%, a difference of 0.010%), Estonian (9.8%, a difference of 0.060%), Immigrants from Moldova (9.8%, a difference of 0.17%), Immigrants from South Africa (9.8%, a difference of 0.27%), and Latvian (9.8%, a difference of 0.32%).
| Demographics | Rating | Rank | No Vehicles in Household |
| Immigrants | Thailand | 92.6 /100 | #120 | Exceptional 9.5% |
| Puget Sound Salish | 92.4 /100 | #121 | Exceptional 9.5% |
| Costa Ricans | 92.3 /100 | #122 | Exceptional 9.5% |
| Blackfeet | 91.4 /100 | #123 | Exceptional 9.6% |
| Immigrants | Korea | 90.9 /100 | #124 | Exceptional 9.6% |
| Immigrants | Cameroon | 90.6 /100 | #125 | Exceptional 9.6% |
| Icelanders | 90.2 /100 | #126 | Exceptional 9.6% |
| Immigrants | Kenya | 89.7 /100 | #127 | Excellent 9.6% |
| Immigrants | Syria | 89.5 /100 | #128 | Excellent 9.6% |
| Nicaraguans | 89.5 /100 | #129 | Excellent 9.7% |
| Burmese | 88.8 /100 | #130 | Excellent 9.7% |
| Immigrants | Azores | 88.2 /100 | #131 | Excellent 9.7% |
| Kenyans | 88.0 /100 | #132 | Excellent 9.7% |
| Immigrants | Oceania | 87.1 /100 | #133 | Excellent 9.7% |
| Syrians | 87.1 /100 | #134 | Excellent 9.7% |
| Latvians | 85.1 /100 | #135 | Excellent 9.8% |
| Immigrants | South Africa | 85.0 /100 | #136 | Excellent 9.8% |
| Immigrants | Moldova | 84.6 /100 | #137 | Excellent 9.8% |
| Estonians | 84.2 /100 | #138 | Excellent 9.8% |
| Marshallese | 84.0 /100 | #139 | Excellent 9.8% |
| Immigrants | Lithuania | 84.0 /100 | #140 | Excellent 9.8% |