Puget Sound Salish vs Chilean 1 or more Vehicles in Household
COMPARE
Puget Sound Salish
Chilean
1 or more Vehicles in Household
1 or more Vehicles in Household Comparison
Puget Sound Salish
Chileans
90.5%
1 OR MORE VEHICLES IN HOUSEHOLD
91.5/ 100
METRIC RATING
124th/ 347
METRIC RANK
90.2%
1 OR MORE VEHICLES IN HOUSEHOLD
79.8/ 100
METRIC RATING
147th/ 347
METRIC RANK
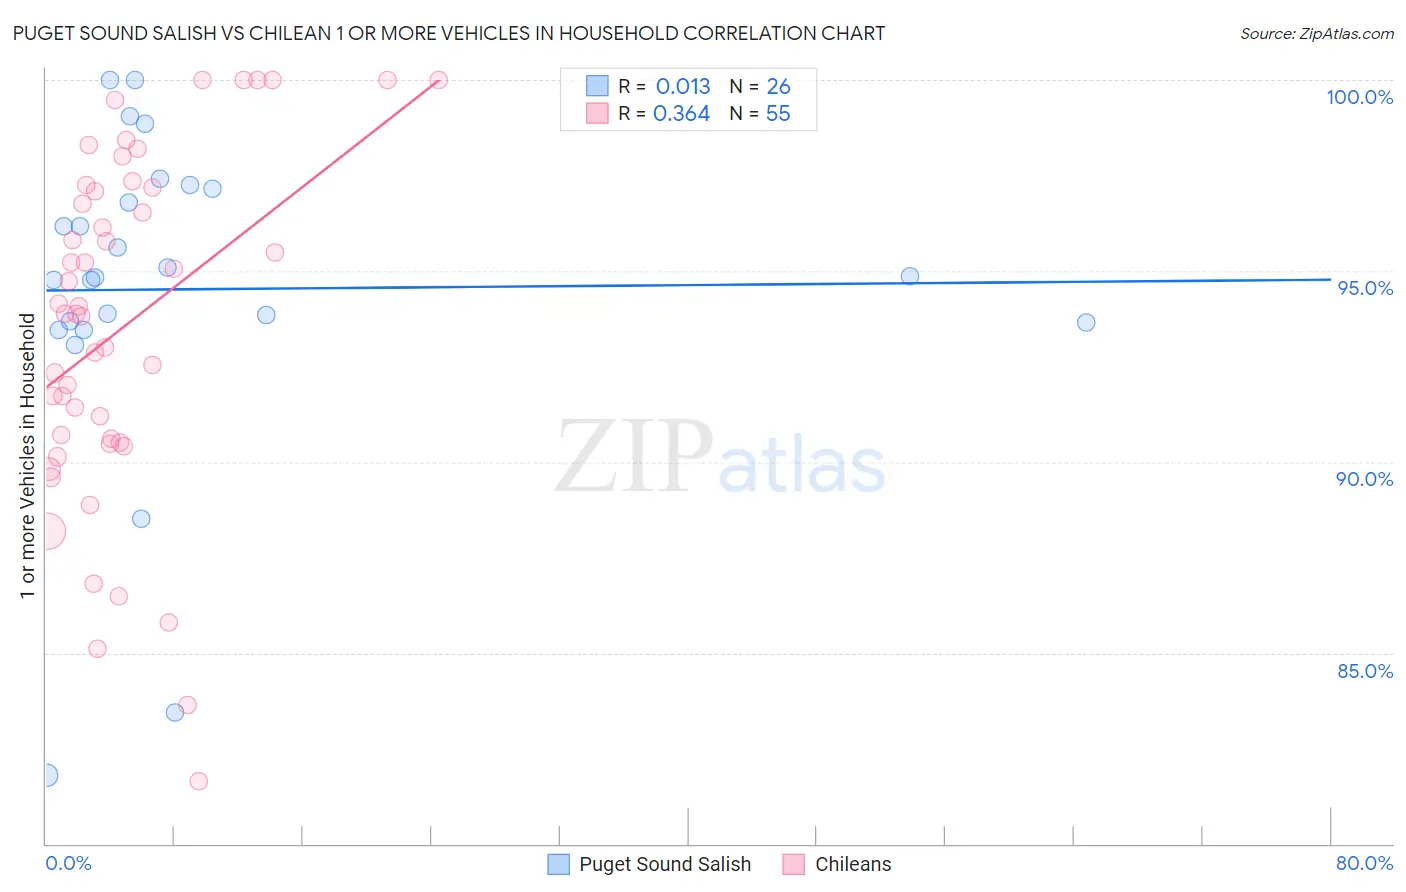
Puget Sound Salish vs Chilean 1 or more Vehicles in Household Correlation Chart
The statistical analysis conducted on geographies consisting of 46,155,865 people shows no correlation between the proportion of Puget Sound Salish and percentage of households with 1 or more vehicles available in the United States with a correlation coefficient (R) of 0.013 and weighted average of 90.5%. Similarly, the statistical analysis conducted on geographies consisting of 256,602,415 people shows a mild positive correlation between the proportion of Chileans and percentage of households with 1 or more vehicles available in the United States with a correlation coefficient (R) of 0.364 and weighted average of 90.2%, a difference of 0.39%.
1 or more Vehicles in Household Correlation Summary
| Measurement | Puget Sound Salish | Chilean |
| Minimum | 81.8% | 81.6% |
| Maximum | 100.0% | 100.0% |
| Range | 18.2% | 18.4% |
| Mean | 94.5% | 93.6% |
| Median | 94.8% | 93.9% |
| Interquartile 25% (IQ1) | 93.7% | 90.5% |
| Interquartile 75% (IQ3) | 97.2% | 97.2% |
| Interquartile Range (IQR) | 3.5% | 6.7% |
| Standard Deviation (Sample) | 4.3% | 4.5% |
| Standard Deviation (Population) | 4.2% | 4.5% |
Similar Demographics by 1 or more Vehicles in Household
Demographics Similar to Puget Sound Salish by 1 or more Vehicles in Household
In terms of 1 or more vehicles in household, the demographic groups most similar to Puget Sound Salish are Costa Rican (90.5%, a difference of 0.020%), Fijian (90.5%, a difference of 0.020%), Icelander (90.5%, a difference of 0.030%), Immigrants from Thailand (90.6%, a difference of 0.040%), and Immigrants from Korea (90.5%, a difference of 0.040%).
| Demographics | Rating | Rank | 1 or more Vehicles in Household |
| Greeks | 93.5 /100 | #117 | Exceptional 90.6% |
| Japanese | 93.4 /100 | #118 | Exceptional 90.6% |
| Blackfeet | 92.6 /100 | #119 | Exceptional 90.6% |
| Immigrants | Thailand | 92.3 /100 | #120 | Exceptional 90.6% |
| Icelanders | 92.1 /100 | #121 | Exceptional 90.5% |
| Costa Ricans | 92.0 /100 | #122 | Exceptional 90.5% |
| Fijians | 91.8 /100 | #123 | Exceptional 90.5% |
| Puget Sound Salish | 91.5 /100 | #124 | Exceptional 90.5% |
| Immigrants | Korea | 90.5 /100 | #125 | Exceptional 90.5% |
| Immigrants | Cameroon | 89.4 /100 | #126 | Excellent 90.4% |
| Immigrants | Azores | 89.1 /100 | #127 | Excellent 90.4% |
| Burmese | 89.0 /100 | #128 | Excellent 90.4% |
| Marshallese | 88.9 /100 | #129 | Excellent 90.4% |
| Nicaraguans | 88.8 /100 | #130 | Excellent 90.4% |
| Immigrants | Kenya | 88.5 /100 | #131 | Excellent 90.4% |
Demographics Similar to Chileans by 1 or more Vehicles in Household
In terms of 1 or more vehicles in household, the demographic groups most similar to Chileans are Bahamian (90.2%, a difference of 0.020%), Immigrants from Bahamas (90.2%, a difference of 0.040%), Immigrants from Zimbabwe (90.2%, a difference of 0.040%), Sioux (90.2%, a difference of 0.040%), and Immigrants from Eastern Africa (90.1%, a difference of 0.040%).
| Demographics | Rating | Rank | 1 or more Vehicles in Household |
| Sudanese | 85.2 /100 | #140 | Excellent 90.3% |
| Immigrants | Moldova | 83.1 /100 | #141 | Excellent 90.2% |
| Immigrants | Lithuania | 83.0 /100 | #142 | Excellent 90.2% |
| Immigrants | Bahamas | 81.5 /100 | #143 | Excellent 90.2% |
| Immigrants | Zimbabwe | 81.5 /100 | #144 | Excellent 90.2% |
| Sioux | 81.3 /100 | #145 | Excellent 90.2% |
| Bahamians | 80.5 /100 | #146 | Excellent 90.2% |
| Chileans | 79.8 /100 | #147 | Good 90.2% |
| Immigrants | Eastern Africa | 78.2 /100 | #148 | Good 90.1% |
| Immigrants | Nicaragua | 76.7 /100 | #149 | Good 90.1% |
| Immigrants | Micronesia | 75.9 /100 | #150 | Good 90.1% |
| Immigrants | Bosnia and Herzegovina | 75.4 /100 | #151 | Good 90.1% |
| Tlingit-Haida | 74.3 /100 | #152 | Good 90.1% |
| New Zealanders | 73.8 /100 | #153 | Good 90.1% |
| Immigrants | Uganda | 73.8 /100 | #154 | Good 90.1% |