Puget Sound Salish vs Immigrants from Australia 1 or more Vehicles in Household
COMPARE
Puget Sound Salish
Immigrants from Australia
1 or more Vehicles in Household
1 or more Vehicles in Household Comparison
Puget Sound Salish
Immigrants from Australia
90.5%
1 OR MORE VEHICLES IN HOUSEHOLD
91.5/ 100
METRIC RATING
124th/ 347
METRIC RANK
86.4%
1 OR MORE VEHICLES IN HOUSEHOLD
0.0/ 100
METRIC RATING
290th/ 347
METRIC RANK
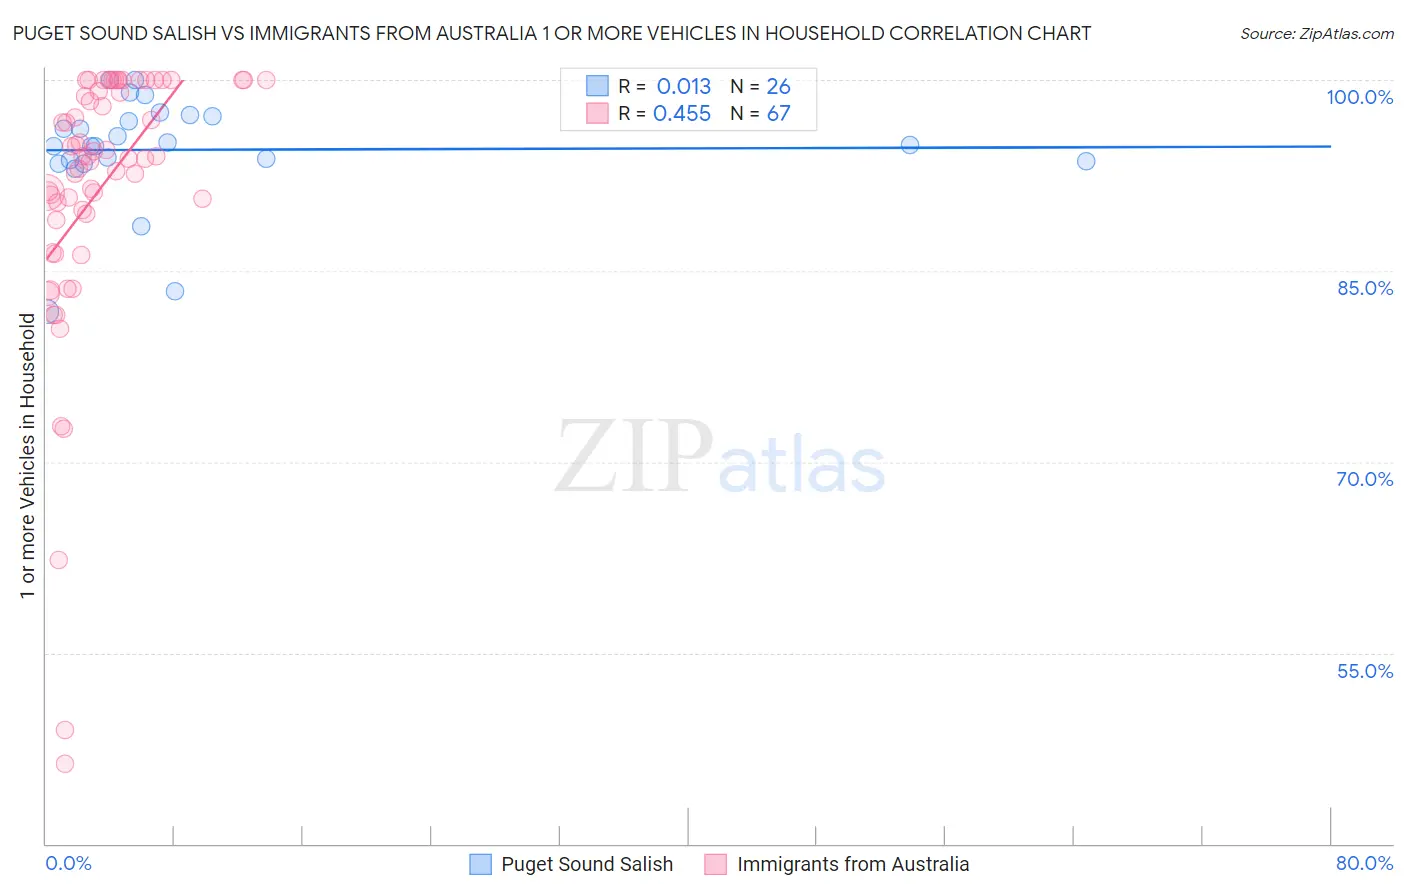
Puget Sound Salish vs Immigrants from Australia 1 or more Vehicles in Household Correlation Chart
The statistical analysis conducted on geographies consisting of 46,155,865 people shows no correlation between the proportion of Puget Sound Salish and percentage of households with 1 or more vehicles available in the United States with a correlation coefficient (R) of 0.013 and weighted average of 90.5%. Similarly, the statistical analysis conducted on geographies consisting of 227,104,870 people shows a moderate positive correlation between the proportion of Immigrants from Australia and percentage of households with 1 or more vehicles available in the United States with a correlation coefficient (R) of 0.455 and weighted average of 86.4%, a difference of 4.8%.
1 or more Vehicles in Household Correlation Summary
| Measurement | Puget Sound Salish | Immigrants from Australia |
| Minimum | 81.8% | 46.3% |
| Maximum | 100.0% | 100.0% |
| Range | 18.2% | 53.7% |
| Mean | 94.5% | 91.4% |
| Median | 94.8% | 94.0% |
| Interquartile 25% (IQ1) | 93.7% | 89.4% |
| Interquartile 75% (IQ3) | 97.2% | 100.0% |
| Interquartile Range (IQR) | 3.5% | 10.6% |
| Standard Deviation (Sample) | 4.3% | 10.9% |
| Standard Deviation (Population) | 4.2% | 10.8% |
Similar Demographics by 1 or more Vehicles in Household
Demographics Similar to Puget Sound Salish by 1 or more Vehicles in Household
In terms of 1 or more vehicles in household, the demographic groups most similar to Puget Sound Salish are Costa Rican (90.5%, a difference of 0.020%), Fijian (90.5%, a difference of 0.020%), Icelander (90.5%, a difference of 0.030%), Immigrants from Thailand (90.6%, a difference of 0.040%), and Immigrants from Korea (90.5%, a difference of 0.040%).
| Demographics | Rating | Rank | 1 or more Vehicles in Household |
| Greeks | 93.5 /100 | #117 | Exceptional 90.6% |
| Japanese | 93.4 /100 | #118 | Exceptional 90.6% |
| Blackfeet | 92.6 /100 | #119 | Exceptional 90.6% |
| Immigrants | Thailand | 92.3 /100 | #120 | Exceptional 90.6% |
| Icelanders | 92.1 /100 | #121 | Exceptional 90.5% |
| Costa Ricans | 92.0 /100 | #122 | Exceptional 90.5% |
| Fijians | 91.8 /100 | #123 | Exceptional 90.5% |
| Puget Sound Salish | 91.5 /100 | #124 | Exceptional 90.5% |
| Immigrants | Korea | 90.5 /100 | #125 | Exceptional 90.5% |
| Immigrants | Cameroon | 89.4 /100 | #126 | Excellent 90.4% |
| Immigrants | Azores | 89.1 /100 | #127 | Excellent 90.4% |
| Burmese | 89.0 /100 | #128 | Excellent 90.4% |
| Marshallese | 88.9 /100 | #129 | Excellent 90.4% |
| Nicaraguans | 88.8 /100 | #130 | Excellent 90.4% |
| Immigrants | Kenya | 88.5 /100 | #131 | Excellent 90.4% |
Demographics Similar to Immigrants from Australia by 1 or more Vehicles in Household
In terms of 1 or more vehicles in household, the demographic groups most similar to Immigrants from Australia are Immigrants from Ireland (86.4%, a difference of 0.040%), Hopi (86.4%, a difference of 0.060%), Pima (86.3%, a difference of 0.080%), Immigrants from Malaysia (86.5%, a difference of 0.13%), and Immigrants from Eastern Asia (86.5%, a difference of 0.21%).
| Demographics | Rating | Rank | 1 or more Vehicles in Household |
| Immigrants | Eastern Europe | 0.0 /100 | #283 | Tragic 86.7% |
| Central American Indians | 0.0 /100 | #284 | Tragic 86.7% |
| Immigrants | Kazakhstan | 0.0 /100 | #285 | Tragic 86.6% |
| Immigrants | Eastern Asia | 0.0 /100 | #286 | Tragic 86.5% |
| Immigrants | Malaysia | 0.0 /100 | #287 | Tragic 86.5% |
| Hopi | 0.0 /100 | #288 | Tragic 86.4% |
| Immigrants | Ireland | 0.0 /100 | #289 | Tragic 86.4% |
| Immigrants | Australia | 0.0 /100 | #290 | Tragic 86.4% |
| Pima | 0.0 /100 | #291 | Tragic 86.3% |
| Okinawans | 0.0 /100 | #292 | Tragic 86.1% |
| Indians (Asian) | 0.0 /100 | #293 | Tragic 86.0% |
| Alaskan Athabascans | 0.0 /100 | #294 | Tragic 86.0% |
| Immigrants | Jamaica | 0.0 /100 | #295 | Tragic 85.8% |
| Immigrants | Spain | 0.0 /100 | #296 | Tragic 85.8% |
| Paraguayans | 0.0 /100 | #297 | Tragic 85.7% |