Immigrants from West Indies vs Chilean 1 or more Vehicles in Household
COMPARE
Immigrants from West Indies
Chilean
1 or more Vehicles in Household
1 or more Vehicles in Household Comparison
Immigrants from West Indies
Chileans
79.5%
1 OR MORE VEHICLES IN HOUSEHOLD
0.0/ 100
METRIC RATING
326th/ 347
METRIC RANK
90.2%
1 OR MORE VEHICLES IN HOUSEHOLD
79.8/ 100
METRIC RATING
147th/ 347
METRIC RANK
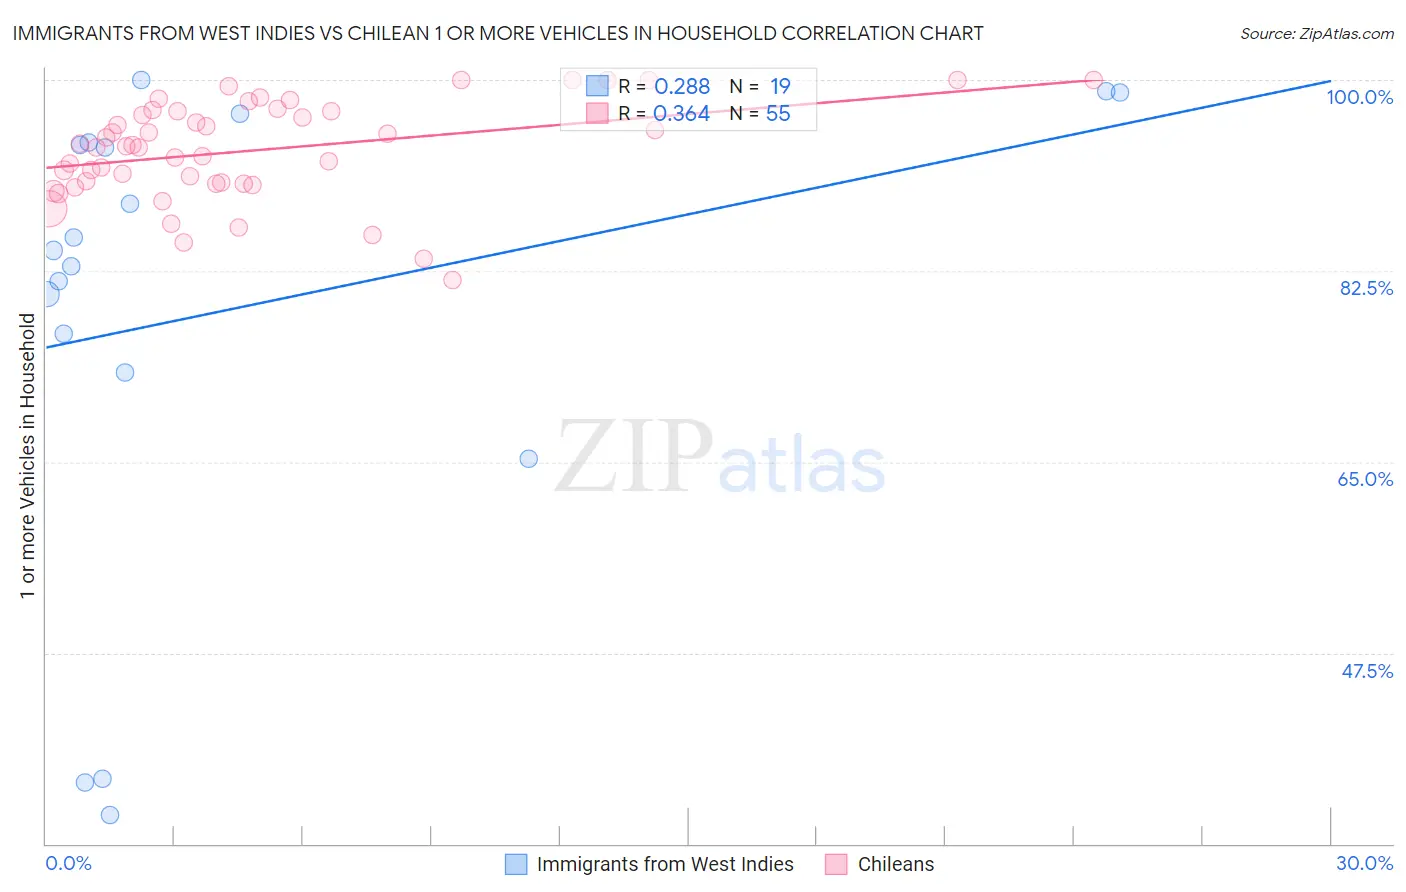
Immigrants from West Indies vs Chilean 1 or more Vehicles in Household Correlation Chart
The statistical analysis conducted on geographies consisting of 72,454,628 people shows a weak positive correlation between the proportion of Immigrants from West Indies and percentage of households with 1 or more vehicles available in the United States with a correlation coefficient (R) of 0.288 and weighted average of 79.5%. Similarly, the statistical analysis conducted on geographies consisting of 256,602,415 people shows a mild positive correlation between the proportion of Chileans and percentage of households with 1 or more vehicles available in the United States with a correlation coefficient (R) of 0.364 and weighted average of 90.2%, a difference of 13.4%.
1 or more Vehicles in Household Correlation Summary
| Measurement | Immigrants from West Indies | Chilean |
| Minimum | 32.7% | 81.6% |
| Maximum | 100.0% | 100.0% |
| Range | 67.3% | 18.4% |
| Mean | 78.9% | 93.6% |
| Median | 84.4% | 93.9% |
| Interquartile 25% (IQ1) | 73.2% | 90.5% |
| Interquartile 75% (IQ3) | 94.3% | 97.2% |
| Interquartile Range (IQR) | 21.1% | 6.7% |
| Standard Deviation (Sample) | 21.8% | 4.5% |
| Standard Deviation (Population) | 21.2% | 4.5% |
Similar Demographics by 1 or more Vehicles in Household
Demographics Similar to Immigrants from West Indies by 1 or more Vehicles in Household
In terms of 1 or more vehicles in household, the demographic groups most similar to Immigrants from West Indies are Immigrants from Senegal (79.0%, a difference of 0.63%), Senegalese (80.4%, a difference of 1.1%), Immigrants from Caribbean (80.4%, a difference of 1.2%), Immigrants from Yemen (80.5%, a difference of 1.3%), and Ecuadorian (77.9%, a difference of 2.0%).
| Demographics | Rating | Rank | 1 or more Vehicles in Household |
| Immigrants | Belarus | 0.0 /100 | #319 | Tragic 83.3% |
| Soviet Union | 0.0 /100 | #320 | Tragic 82.7% |
| Jamaicans | 0.0 /100 | #321 | Tragic 82.1% |
| Immigrants | Cabo Verde | 0.0 /100 | #322 | Tragic 81.6% |
| Immigrants | Yemen | 0.0 /100 | #323 | Tragic 80.5% |
| Immigrants | Caribbean | 0.0 /100 | #324 | Tragic 80.4% |
| Senegalese | 0.0 /100 | #325 | Tragic 80.4% |
| Immigrants | West Indies | 0.0 /100 | #326 | Tragic 79.5% |
| Immigrants | Senegal | 0.0 /100 | #327 | Tragic 79.0% |
| Ecuadorians | 0.0 /100 | #328 | Tragic 77.9% |
| Immigrants | Dominica | 0.0 /100 | #329 | Tragic 77.8% |
| Immigrants | Trinidad and Tobago | 0.0 /100 | #330 | Tragic 76.8% |
| West Indians | 0.0 /100 | #331 | Tragic 76.4% |
| Trinidadians and Tobagonians | 0.0 /100 | #332 | Tragic 76.3% |
| Immigrants | Ecuador | 0.0 /100 | #333 | Tragic 76.2% |
Demographics Similar to Chileans by 1 or more Vehicles in Household
In terms of 1 or more vehicles in household, the demographic groups most similar to Chileans are Bahamian (90.2%, a difference of 0.020%), Immigrants from Bahamas (90.2%, a difference of 0.040%), Immigrants from Zimbabwe (90.2%, a difference of 0.040%), Sioux (90.2%, a difference of 0.040%), and Immigrants from Eastern Africa (90.1%, a difference of 0.040%).
| Demographics | Rating | Rank | 1 or more Vehicles in Household |
| Sudanese | 85.2 /100 | #140 | Excellent 90.3% |
| Immigrants | Moldova | 83.1 /100 | #141 | Excellent 90.2% |
| Immigrants | Lithuania | 83.0 /100 | #142 | Excellent 90.2% |
| Immigrants | Bahamas | 81.5 /100 | #143 | Excellent 90.2% |
| Immigrants | Zimbabwe | 81.5 /100 | #144 | Excellent 90.2% |
| Sioux | 81.3 /100 | #145 | Excellent 90.2% |
| Bahamians | 80.5 /100 | #146 | Excellent 90.2% |
| Chileans | 79.8 /100 | #147 | Good 90.2% |
| Immigrants | Eastern Africa | 78.2 /100 | #148 | Good 90.1% |
| Immigrants | Nicaragua | 76.7 /100 | #149 | Good 90.1% |
| Immigrants | Micronesia | 75.9 /100 | #150 | Good 90.1% |
| Immigrants | Bosnia and Herzegovina | 75.4 /100 | #151 | Good 90.1% |
| Tlingit-Haida | 74.3 /100 | #152 | Good 90.1% |
| New Zealanders | 73.8 /100 | #153 | Good 90.1% |
| Immigrants | Uganda | 73.8 /100 | #154 | Good 90.1% |