German Russian vs Chilean 1 or more Vehicles in Household
COMPARE
German Russian
Chilean
1 or more Vehicles in Household
1 or more Vehicles in Household Comparison
German Russians
Chileans
89.6%
1 OR MORE VEHICLES IN HOUSEHOLD
44.0/ 100
METRIC RATING
179th/ 347
METRIC RANK
90.2%
1 OR MORE VEHICLES IN HOUSEHOLD
79.8/ 100
METRIC RATING
147th/ 347
METRIC RANK
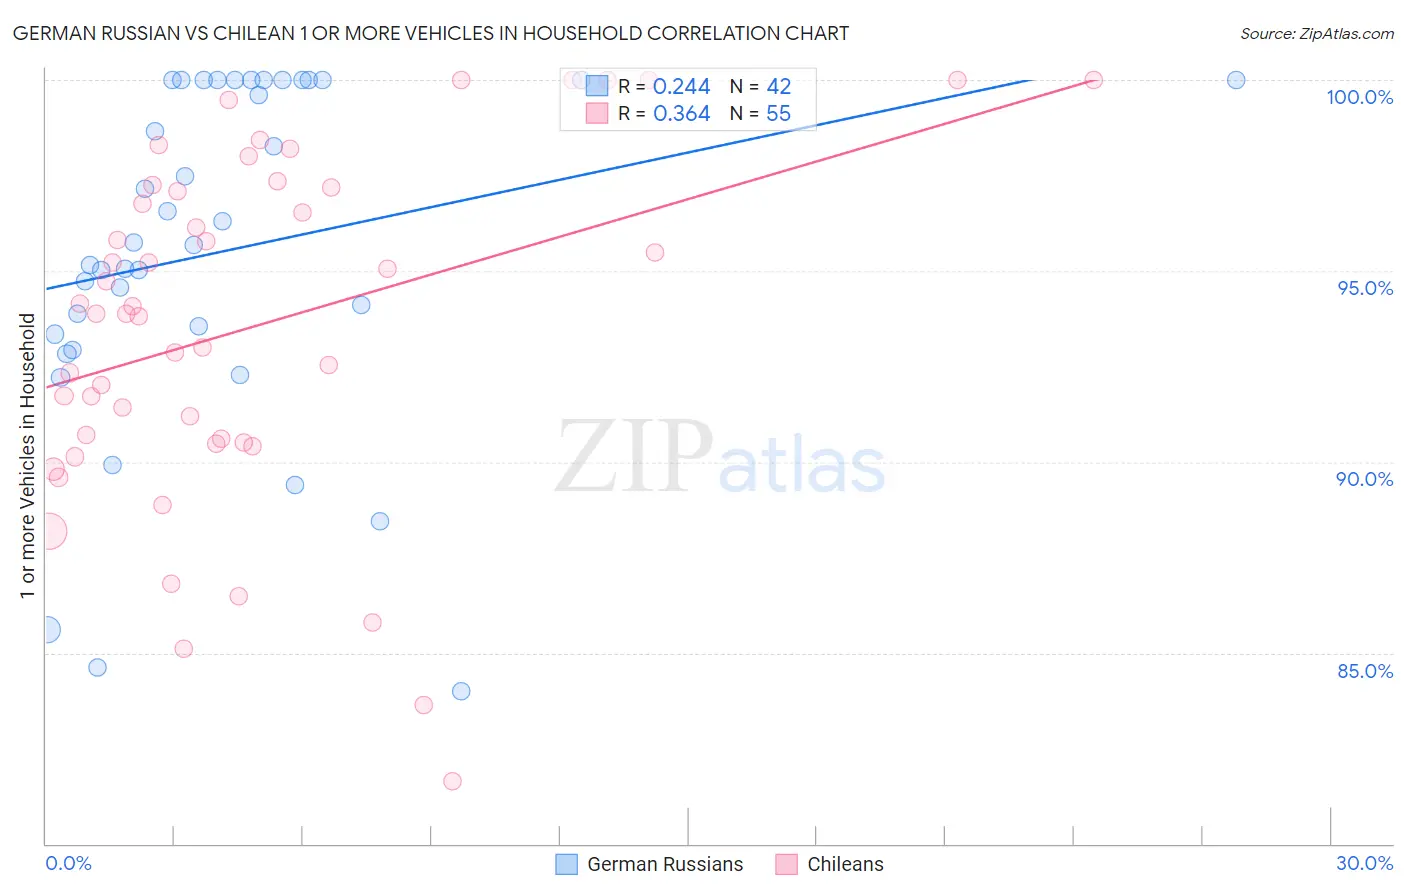
German Russian vs Chilean 1 or more Vehicles in Household Correlation Chart
The statistical analysis conducted on geographies consisting of 96,439,918 people shows a weak positive correlation between the proportion of German Russians and percentage of households with 1 or more vehicles available in the United States with a correlation coefficient (R) of 0.244 and weighted average of 89.6%. Similarly, the statistical analysis conducted on geographies consisting of 256,602,415 people shows a mild positive correlation between the proportion of Chileans and percentage of households with 1 or more vehicles available in the United States with a correlation coefficient (R) of 0.364 and weighted average of 90.2%, a difference of 0.63%.
1 or more Vehicles in Household Correlation Summary
| Measurement | German Russian | Chilean |
| Minimum | 84.0% | 81.6% |
| Maximum | 100.0% | 100.0% |
| Range | 16.0% | 18.4% |
| Mean | 95.5% | 93.6% |
| Median | 95.7% | 93.9% |
| Interquartile 25% (IQ1) | 93.3% | 90.5% |
| Interquartile 75% (IQ3) | 100.0% | 97.2% |
| Interquartile Range (IQR) | 6.7% | 6.7% |
| Standard Deviation (Sample) | 4.5% | 4.5% |
| Standard Deviation (Population) | 4.4% | 4.5% |
Similar Demographics by 1 or more Vehicles in Household
Demographics Similar to German Russians by 1 or more Vehicles in Household
In terms of 1 or more vehicles in household, the demographic groups most similar to German Russians are Immigrants from El Salvador (89.6%, a difference of 0.0%), Arab (89.6%, a difference of 0.010%), Immigrants from Ethiopia (89.6%, a difference of 0.020%), Hmong (89.6%, a difference of 0.030%), and Ukrainian (89.6%, a difference of 0.030%).
| Demographics | Rating | Rank | 1 or more Vehicles in Household |
| Indonesians | 53.0 /100 | #172 | Average 89.7% |
| Lumbee | 52.8 /100 | #173 | Average 89.7% |
| Filipinos | 50.0 /100 | #174 | Average 89.7% |
| Immigrants | Burma/Myanmar | 47.6 /100 | #175 | Average 89.7% |
| Immigrants | Sudan | 47.1 /100 | #176 | Average 89.7% |
| Hmong | 45.8 /100 | #177 | Average 89.6% |
| Immigrants | El Salvador | 44.1 /100 | #178 | Average 89.6% |
| German Russians | 44.0 /100 | #179 | Average 89.6% |
| Arabs | 43.3 /100 | #180 | Average 89.6% |
| Immigrants | Ethiopia | 42.5 /100 | #181 | Average 89.6% |
| Ukrainians | 42.4 /100 | #182 | Average 89.6% |
| Ethiopians | 41.2 /100 | #183 | Average 89.6% |
| Immigrants | Bulgaria | 40.7 /100 | #184 | Average 89.6% |
| Immigrants | Brazil | 40.1 /100 | #185 | Average 89.6% |
| Pueblo | 39.9 /100 | #186 | Fair 89.6% |
Demographics Similar to Chileans by 1 or more Vehicles in Household
In terms of 1 or more vehicles in household, the demographic groups most similar to Chileans are Bahamian (90.2%, a difference of 0.020%), Immigrants from Bahamas (90.2%, a difference of 0.040%), Immigrants from Zimbabwe (90.2%, a difference of 0.040%), Sioux (90.2%, a difference of 0.040%), and Immigrants from Eastern Africa (90.1%, a difference of 0.040%).
| Demographics | Rating | Rank | 1 or more Vehicles in Household |
| Sudanese | 85.2 /100 | #140 | Excellent 90.3% |
| Immigrants | Moldova | 83.1 /100 | #141 | Excellent 90.2% |
| Immigrants | Lithuania | 83.0 /100 | #142 | Excellent 90.2% |
| Immigrants | Bahamas | 81.5 /100 | #143 | Excellent 90.2% |
| Immigrants | Zimbabwe | 81.5 /100 | #144 | Excellent 90.2% |
| Sioux | 81.3 /100 | #145 | Excellent 90.2% |
| Bahamians | 80.5 /100 | #146 | Excellent 90.2% |
| Chileans | 79.8 /100 | #147 | Good 90.2% |
| Immigrants | Eastern Africa | 78.2 /100 | #148 | Good 90.1% |
| Immigrants | Nicaragua | 76.7 /100 | #149 | Good 90.1% |
| Immigrants | Micronesia | 75.9 /100 | #150 | Good 90.1% |
| Immigrants | Bosnia and Herzegovina | 75.4 /100 | #151 | Good 90.1% |
| Tlingit-Haida | 74.3 /100 | #152 | Good 90.1% |
| New Zealanders | 73.8 /100 | #153 | Good 90.1% |
| Immigrants | Uganda | 73.8 /100 | #154 | Good 90.1% |