Hispanic or Latino vs Chilean 1 or more Vehicles in Household
COMPARE
Hispanic or Latino
Chilean
1 or more Vehicles in Household
1 or more Vehicles in Household Comparison
Hispanics or Latinos
Chileans
91.0%
1 OR MORE VEHICLES IN HOUSEHOLD
97.6/ 100
METRIC RATING
108th/ 347
METRIC RANK
90.2%
1 OR MORE VEHICLES IN HOUSEHOLD
79.8/ 100
METRIC RATING
147th/ 347
METRIC RANK
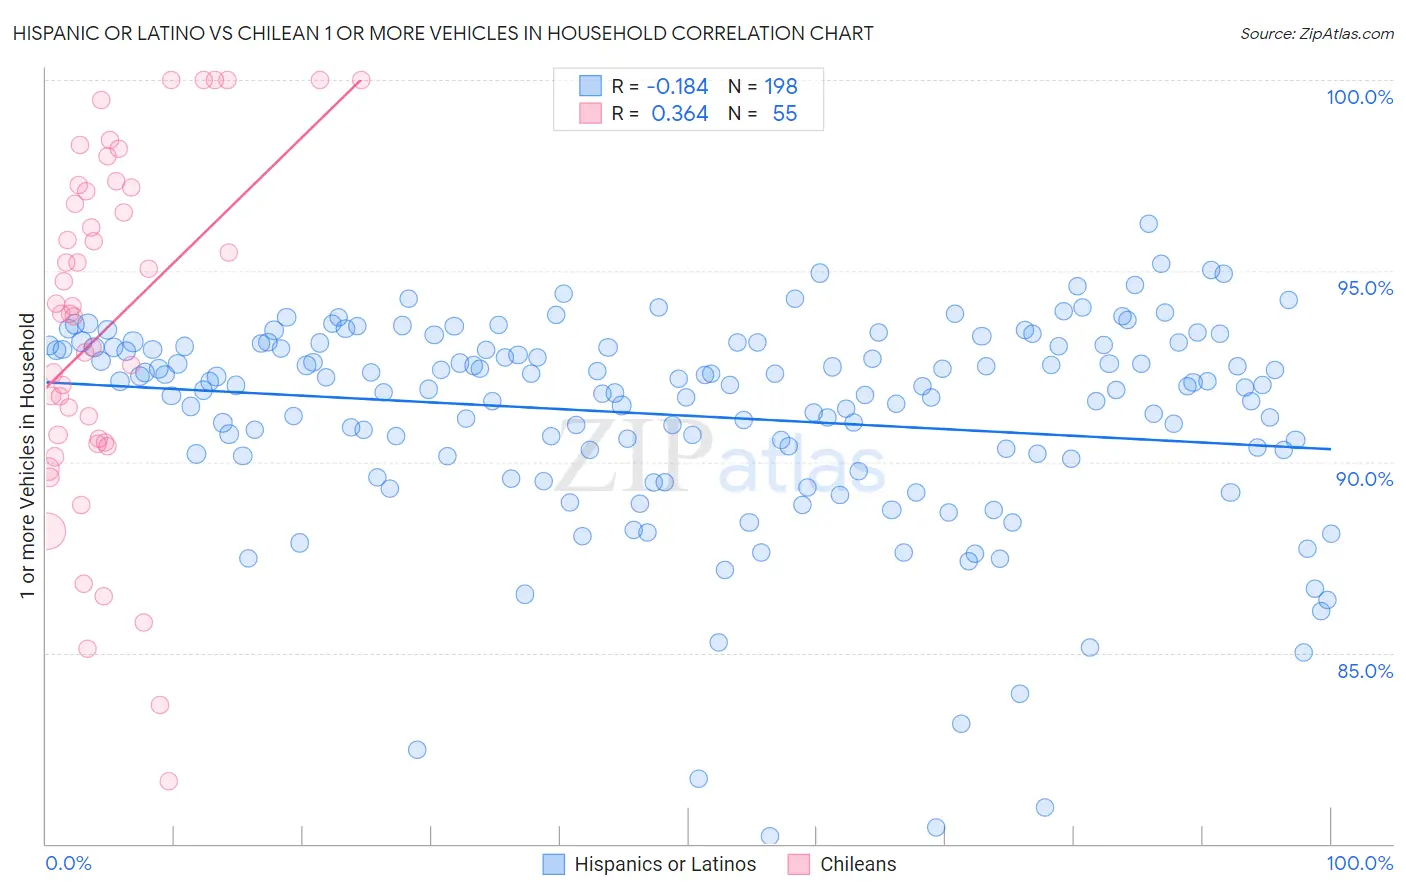
Hispanic or Latino vs Chilean 1 or more Vehicles in Household Correlation Chart
The statistical analysis conducted on geographies consisting of 564,196,791 people shows a poor negative correlation between the proportion of Hispanics or Latinos and percentage of households with 1 or more vehicles available in the United States with a correlation coefficient (R) of -0.184 and weighted average of 91.0%. Similarly, the statistical analysis conducted on geographies consisting of 256,602,415 people shows a mild positive correlation between the proportion of Chileans and percentage of households with 1 or more vehicles available in the United States with a correlation coefficient (R) of 0.364 and weighted average of 90.2%, a difference of 0.91%.
1 or more Vehicles in Household Correlation Summary
| Measurement | Hispanic or Latino | Chilean |
| Minimum | 80.2% | 81.6% |
| Maximum | 96.2% | 100.0% |
| Range | 16.0% | 18.4% |
| Mean | 91.2% | 93.6% |
| Median | 92.0% | 93.9% |
| Interquartile 25% (IQ1) | 90.2% | 90.5% |
| Interquartile 75% (IQ3) | 93.0% | 97.2% |
| Interquartile Range (IQR) | 2.8% | 6.7% |
| Standard Deviation (Sample) | 2.8% | 4.5% |
| Standard Deviation (Population) | 2.8% | 4.5% |
Similar Demographics by 1 or more Vehicles in Household
Demographics Similar to Hispanics or Latinos by 1 or more Vehicles in Household
In terms of 1 or more vehicles in household, the demographic groups most similar to Hispanics or Latinos are Maltese (91.0%, a difference of 0.0%), Delaware (91.0%, a difference of 0.0%), Zimbabwean (91.0%, a difference of 0.020%), Mexican American Indian (91.0%, a difference of 0.030%), and Laotian (91.0%, a difference of 0.060%).
| Demographics | Rating | Rank | 1 or more Vehicles in Household |
| Bulgarians | 98.4 /100 | #101 | Exceptional 91.1% |
| Seminole | 98.3 /100 | #102 | Exceptional 91.1% |
| Yugoslavians | 98.3 /100 | #103 | Exceptional 91.1% |
| Asians | 98.2 /100 | #104 | Exceptional 91.1% |
| Laotians | 98.0 /100 | #105 | Exceptional 91.0% |
| Zimbabweans | 97.7 /100 | #106 | Exceptional 91.0% |
| Maltese | 97.7 /100 | #107 | Exceptional 91.0% |
| Hispanics or Latinos | 97.6 /100 | #108 | Exceptional 91.0% |
| Delaware | 97.6 /100 | #109 | Exceptional 91.0% |
| Mexican American Indians | 97.4 /100 | #110 | Exceptional 91.0% |
| Navajo | 95.8 /100 | #111 | Exceptional 90.8% |
| Immigrants | Netherlands | 95.7 /100 | #112 | Exceptional 90.8% |
| Immigrants | Kuwait | 94.7 /100 | #113 | Exceptional 90.7% |
| Armenians | 94.5 /100 | #114 | Exceptional 90.7% |
| Serbians | 94.3 /100 | #115 | Exceptional 90.7% |
Demographics Similar to Chileans by 1 or more Vehicles in Household
In terms of 1 or more vehicles in household, the demographic groups most similar to Chileans are Bahamian (90.2%, a difference of 0.020%), Immigrants from Bahamas (90.2%, a difference of 0.040%), Immigrants from Zimbabwe (90.2%, a difference of 0.040%), Sioux (90.2%, a difference of 0.040%), and Immigrants from Eastern Africa (90.1%, a difference of 0.040%).
| Demographics | Rating | Rank | 1 or more Vehicles in Household |
| Sudanese | 85.2 /100 | #140 | Excellent 90.3% |
| Immigrants | Moldova | 83.1 /100 | #141 | Excellent 90.2% |
| Immigrants | Lithuania | 83.0 /100 | #142 | Excellent 90.2% |
| Immigrants | Bahamas | 81.5 /100 | #143 | Excellent 90.2% |
| Immigrants | Zimbabwe | 81.5 /100 | #144 | Excellent 90.2% |
| Sioux | 81.3 /100 | #145 | Excellent 90.2% |
| Bahamians | 80.5 /100 | #146 | Excellent 90.2% |
| Chileans | 79.8 /100 | #147 | Good 90.2% |
| Immigrants | Eastern Africa | 78.2 /100 | #148 | Good 90.1% |
| Immigrants | Nicaragua | 76.7 /100 | #149 | Good 90.1% |
| Immigrants | Micronesia | 75.9 /100 | #150 | Good 90.1% |
| Immigrants | Bosnia and Herzegovina | 75.4 /100 | #151 | Good 90.1% |
| Tlingit-Haida | 74.3 /100 | #152 | Good 90.1% |
| New Zealanders | 73.8 /100 | #153 | Good 90.1% |
| Immigrants | Uganda | 73.8 /100 | #154 | Good 90.1% |