Pueblo vs Ecuadorian 2 or more Vehicles in Household
COMPARE
Pueblo
Ecuadorian
2 or more Vehicles in Household
2 or more Vehicles in Household Comparison
Pueblo
Ecuadorians
57.5%
2 OR MORE VEHICLES IN HOUSEHOLD
98.0/ 100
METRIC RATING
112th/ 347
METRIC RANK
42.0%
2 OR MORE VEHICLES IN HOUSEHOLD
0.0/ 100
METRIC RATING
329th/ 347
METRIC RANK
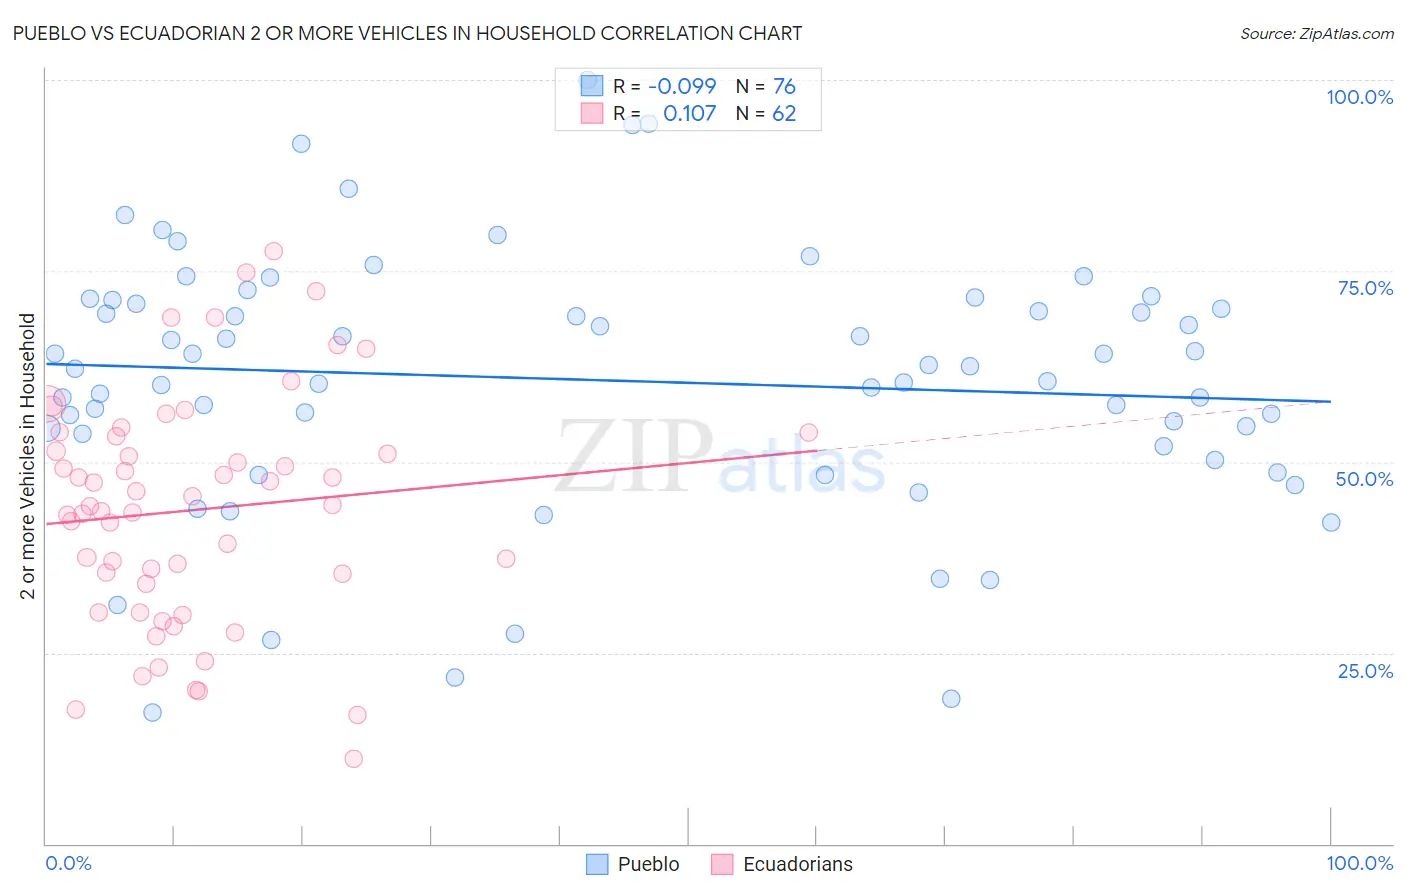
Pueblo vs Ecuadorian 2 or more Vehicles in Household Correlation Chart
The statistical analysis conducted on geographies consisting of 120,072,908 people shows a slight negative correlation between the proportion of Pueblo and percentage of households with 2 or more vehicles available in the United States with a correlation coefficient (R) of -0.099 and weighted average of 57.5%. Similarly, the statistical analysis conducted on geographies consisting of 317,664,097 people shows a poor positive correlation between the proportion of Ecuadorians and percentage of households with 2 or more vehicles available in the United States with a correlation coefficient (R) of 0.107 and weighted average of 42.0%, a difference of 36.9%.
2 or more Vehicles in Household Correlation Summary
| Measurement | Pueblo | Ecuadorian |
| Minimum | 17.1% | 11.1% |
| Maximum | 100.0% | 77.6% |
| Range | 82.9% | 66.5% |
| Mean | 60.7% | 43.7% |
| Median | 62.3% | 44.3% |
| Interquartile 25% (IQ1) | 52.9% | 34.1% |
| Interquartile 75% (IQ3) | 70.9% | 53.3% |
| Interquartile Range (IQR) | 18.0% | 19.3% |
| Standard Deviation (Sample) | 17.0% | 15.0% |
| Standard Deviation (Population) | 16.9% | 14.9% |
Similar Demographics by 2 or more Vehicles in Household
Demographics Similar to Pueblo by 2 or more Vehicles in Household
In terms of 2 or more vehicles in household, the demographic groups most similar to Pueblo are Greek (57.5%, a difference of 0.0%), Japanese (57.5%, a difference of 0.040%), Immigrants from North America (57.5%, a difference of 0.050%), Immigrants from Canada (57.5%, a difference of 0.090%), and Immigrants from Netherlands (57.5%, a difference of 0.10%).
| Demographics | Rating | Rank | 2 or more Vehicles in Household |
| Immigrants | Korea | 98.2 /100 | #105 | Exceptional 57.6% |
| Immigrants | Oceania | 98.2 /100 | #106 | Exceptional 57.5% |
| Immigrants | Netherlands | 98.2 /100 | #107 | Exceptional 57.5% |
| Immigrants | Canada | 98.1 /100 | #108 | Exceptional 57.5% |
| Immigrants | North America | 98.1 /100 | #109 | Exceptional 57.5% |
| Japanese | 98.0 /100 | #110 | Exceptional 57.5% |
| Greeks | 98.0 /100 | #111 | Exceptional 57.5% |
| Pueblo | 98.0 /100 | #112 | Exceptional 57.5% |
| Zimbabweans | 96.9 /100 | #113 | Exceptional 57.2% |
| Immigrants | Lebanon | 96.8 /100 | #114 | Exceptional 57.2% |
| Chippewa | 96.6 /100 | #115 | Exceptional 57.2% |
| Immigrants | Jordan | 96.6 /100 | #116 | Exceptional 57.2% |
| Iraqis | 95.8 /100 | #117 | Exceptional 57.1% |
| Asians | 95.1 /100 | #118 | Exceptional 57.0% |
| Natives/Alaskans | 95.0 /100 | #119 | Exceptional 57.0% |
Demographics Similar to Ecuadorians by 2 or more Vehicles in Household
In terms of 2 or more vehicles in household, the demographic groups most similar to Ecuadorians are Immigrants from Dominica (41.6%, a difference of 0.82%), Inupiat (42.6%, a difference of 1.6%), West Indian (41.3%, a difference of 1.7%), Immigrants from Yemen (42.8%, a difference of 2.1%), and Immigrants from Senegal (43.0%, a difference of 2.5%).
| Demographics | Rating | Rank | 2 or more Vehicles in Household |
| Senegalese | 0.0 /100 | #322 | Tragic 44.2% |
| Immigrants | Caribbean | 0.0 /100 | #323 | Tragic 44.2% |
| Immigrants | Cabo Verde | 0.0 /100 | #324 | Tragic 43.3% |
| Immigrants | West Indies | 0.0 /100 | #325 | Tragic 43.1% |
| Immigrants | Senegal | 0.0 /100 | #326 | Tragic 43.0% |
| Immigrants | Yemen | 0.0 /100 | #327 | Tragic 42.8% |
| Inupiat | 0.0 /100 | #328 | Tragic 42.6% |
| Ecuadorians | 0.0 /100 | #329 | Tragic 42.0% |
| Immigrants | Dominica | 0.0 /100 | #330 | Tragic 41.6% |
| West Indians | 0.0 /100 | #331 | Tragic 41.3% |
| Trinidadians and Tobagonians | 0.0 /100 | #332 | Tragic 40.9% |
| Immigrants | Ecuador | 0.0 /100 | #333 | Tragic 40.5% |
| Immigrants | Trinidad and Tobago | 0.0 /100 | #334 | Tragic 40.3% |
| Immigrants | Bangladesh | 0.0 /100 | #335 | Tragic 38.8% |
| Vietnamese | 0.0 /100 | #336 | Tragic 38.5% |