Immigrants from Iraq vs Ecuadorian 2 or more Vehicles in Household
COMPARE
Immigrants from Iraq
Ecuadorian
2 or more Vehicles in Household
2 or more Vehicles in Household Comparison
Immigrants from Iraq
Ecuadorians
58.1%
2 OR MORE VEHICLES IN HOUSEHOLD
99.3/ 100
METRIC RATING
81st/ 347
METRIC RANK
42.0%
2 OR MORE VEHICLES IN HOUSEHOLD
0.0/ 100
METRIC RATING
329th/ 347
METRIC RANK
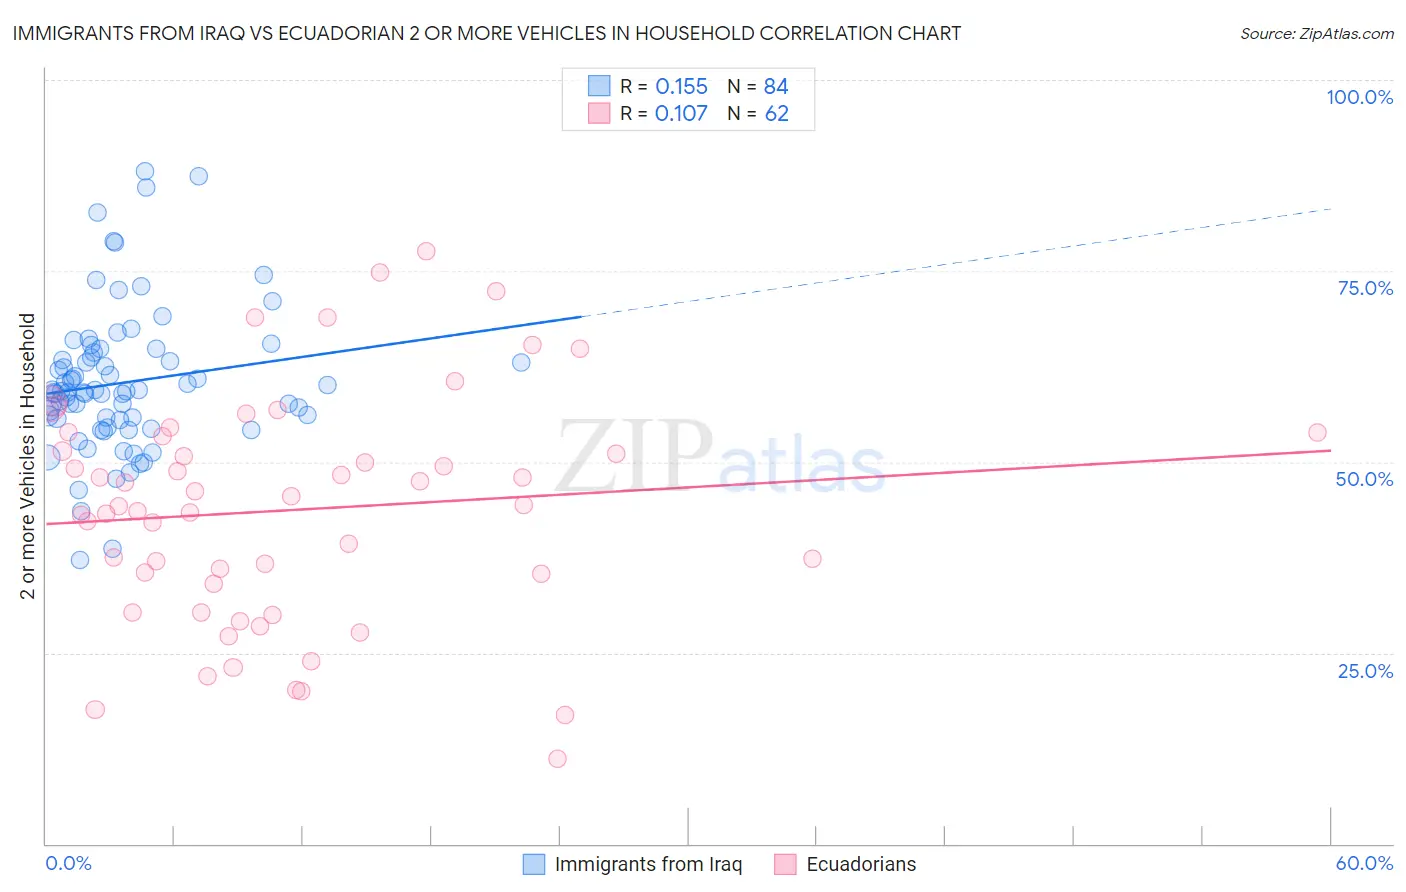
Immigrants from Iraq vs Ecuadorian 2 or more Vehicles in Household Correlation Chart
The statistical analysis conducted on geographies consisting of 194,767,944 people shows a poor positive correlation between the proportion of Immigrants from Iraq and percentage of households with 2 or more vehicles available in the United States with a correlation coefficient (R) of 0.155 and weighted average of 58.1%. Similarly, the statistical analysis conducted on geographies consisting of 317,664,097 people shows a poor positive correlation between the proportion of Ecuadorians and percentage of households with 2 or more vehicles available in the United States with a correlation coefficient (R) of 0.107 and weighted average of 42.0%, a difference of 38.4%.
2 or more Vehicles in Household Correlation Summary
| Measurement | Immigrants from Iraq | Ecuadorian |
| Minimum | 37.2% | 11.1% |
| Maximum | 88.1% | 77.6% |
| Range | 50.9% | 66.5% |
| Mean | 60.4% | 43.7% |
| Median | 59.2% | 44.3% |
| Interquartile 25% (IQ1) | 55.6% | 34.1% |
| Interquartile 75% (IQ3) | 64.0% | 53.3% |
| Interquartile Range (IQR) | 8.4% | 19.3% |
| Standard Deviation (Sample) | 9.5% | 15.0% |
| Standard Deviation (Population) | 9.4% | 14.9% |
Similar Demographics by 2 or more Vehicles in Household
Demographics Similar to Immigrants from Iraq by 2 or more Vehicles in Household
In terms of 2 or more vehicles in household, the demographic groups most similar to Immigrants from Iraq are Immigrants from England (58.1%, a difference of 0.010%), Iranian (58.1%, a difference of 0.080%), Icelander (58.0%, a difference of 0.12%), Delaware (58.2%, a difference of 0.16%), and Maltese (58.0%, a difference of 0.16%).
| Demographics | Rating | Rank | 2 or more Vehicles in Household |
| Immigrants | Afghanistan | 99.6 /100 | #74 | Exceptional 58.3% |
| Poles | 99.5 /100 | #75 | Exceptional 58.3% |
| Creek | 99.5 /100 | #76 | Exceptional 58.3% |
| Slovenes | 99.5 /100 | #77 | Exceptional 58.3% |
| Lithuanians | 99.5 /100 | #78 | Exceptional 58.2% |
| Delaware | 99.4 /100 | #79 | Exceptional 58.2% |
| Immigrants | England | 99.3 /100 | #80 | Exceptional 58.1% |
| Immigrants | Iraq | 99.3 /100 | #81 | Exceptional 58.1% |
| Iranians | 99.3 /100 | #82 | Exceptional 58.1% |
| Icelanders | 99.2 /100 | #83 | Exceptional 58.0% |
| Maltese | 99.2 /100 | #84 | Exceptional 58.0% |
| Slovaks | 99.2 /100 | #85 | Exceptional 58.0% |
| Potawatomi | 99.1 /100 | #86 | Exceptional 58.0% |
| Thais | 99.1 /100 | #87 | Exceptional 57.9% |
| Immigrants | Iran | 99.1 /100 | #88 | Exceptional 57.9% |
Demographics Similar to Ecuadorians by 2 or more Vehicles in Household
In terms of 2 or more vehicles in household, the demographic groups most similar to Ecuadorians are Immigrants from Dominica (41.6%, a difference of 0.82%), Inupiat (42.6%, a difference of 1.6%), West Indian (41.3%, a difference of 1.7%), Immigrants from Yemen (42.8%, a difference of 2.1%), and Immigrants from Senegal (43.0%, a difference of 2.5%).
| Demographics | Rating | Rank | 2 or more Vehicles in Household |
| Senegalese | 0.0 /100 | #322 | Tragic 44.2% |
| Immigrants | Caribbean | 0.0 /100 | #323 | Tragic 44.2% |
| Immigrants | Cabo Verde | 0.0 /100 | #324 | Tragic 43.3% |
| Immigrants | West Indies | 0.0 /100 | #325 | Tragic 43.1% |
| Immigrants | Senegal | 0.0 /100 | #326 | Tragic 43.0% |
| Immigrants | Yemen | 0.0 /100 | #327 | Tragic 42.8% |
| Inupiat | 0.0 /100 | #328 | Tragic 42.6% |
| Ecuadorians | 0.0 /100 | #329 | Tragic 42.0% |
| Immigrants | Dominica | 0.0 /100 | #330 | Tragic 41.6% |
| West Indians | 0.0 /100 | #331 | Tragic 41.3% |
| Trinidadians and Tobagonians | 0.0 /100 | #332 | Tragic 40.9% |
| Immigrants | Ecuador | 0.0 /100 | #333 | Tragic 40.5% |
| Immigrants | Trinidad and Tobago | 0.0 /100 | #334 | Tragic 40.3% |
| Immigrants | Bangladesh | 0.0 /100 | #335 | Tragic 38.8% |
| Vietnamese | 0.0 /100 | #336 | Tragic 38.5% |