Pueblo vs Ecuadorian 8th Grade

COMPARE

Pueblo
Race
Ancestry
AfghanAfricanAlaska NativeAlaskan AthabascanAlbanianAleutAlsatianAmericanApacheArabArapahoArgentineanArmenianAssyrian/Chaldean/SyriacAustralianAustrianBahamianBangladeshiBarbadianBasqueBelgianBelizeanBermudanBhutaneseBlackfeetBolivianBrazilianBritishBritish West IndianBulgarianBurmeseCajunCambodianCanadianCape VerdeanCarpatho RusynCelticCentral AmericanCentral American IndianCherokeeCheyenneChickasawChileanChineseChippewaChoctawColombianColvilleComancheCosta RicanCreeCreekCroatianCrowCubanCypriotCzechCzechoslovakianDanishDelawareDominicanDutchDutch West IndianEastern EuropeanEgyptianEnglishEstonianEthiopianEuropeanFijianFilipinoFinnishFrenchFrench American IndianFrench CanadianGermanGerman RussianGhanaianGreekGuamanian/ChamorroGuatemalanGuyaneseHaitianHmongHonduranHopiHoumaHungarianIcelanderIndian (Asian)IndonesianInupiatIranianIraqiIrishIroquoisIsraeliItalianJamaicanJapaneseJordanianKenyanKiowaKoreanLaotianLatvianLebaneseLiberianLithuanianLumbeeLuxembourgerMacedonianMalaysianMalteseMarshalleseMenomineeMexicanMexican American IndianMongolianMoroccanNative HawaiianNavajoNepaleseNew ZealanderNicaraguanNigerianNorthern EuropeanNorwegianOkinawanOsageOttawaPaiutePakistaniPalestinianPanamanianParaguayanPennsylvania GermanPeruvianPimaPolishPortuguesePotawatomiPuebloPuerto RicanPuget Sound SalishRomanianRussianSalvadoranSamoanScandinavianScotch-IrishScottishSeminoleSenegaleseSerbianShoshoneSierra LeoneanSiouxSlavicSlovakSloveneSomaliSouth AfricanSouth AmericanSouth American IndianSoviet UnionSpaniardSpanishSpanish AmericanSpanish American IndianSri LankanSubsaharan AfricanSudaneseSwedishSwissSyrianTaiwaneseThaiTlingit-HaidaTohono O'OdhamTonganTrinidadian and TobagonianTsimshianTurkishU.S. Virgin IslanderUgandanUkrainianUruguayanUteVenezuelanVietnameseWelshWest IndianYakamaYaquiYugoslavianYumanYup'ikZimbabwean
Immigration
NonimmigrantsImmigrantsAfghanistanAfricaAlbaniaArgentinaArmeniaAsiaAustraliaAustriaBahamasBangladeshBarbadosBelarusBelgiumBelizeBoliviaBosnia and HerzegovinaBrazilBulgariaBurma/MyanmarCabo VerdeCambodiaCameroonCanadaCaribbeanCentral AmericaChileChinaColombiaCongoCosta RicaCroatiaCubaCzechoslovakiaDenmarkDominicaDominican RepublicEastern AfricaEastern AsiaEastern EuropeEcuadorEgyptEl SalvadorEnglandEritreaEthiopiaEuropeFijiFranceGermanyGhanaGreeceGrenadaGuatemalaGuyanaHaitiHondurasHong KongHungaryIndiaIndonesiaIranIraqIrelandIsraelItalyJamaicaJapanJordanKazakhstanKenyaKoreaKuwaitLaosLatin AmericaLatviaLebanonLiberiaLithuaniaMalaysiaMexicoMicronesiaMiddle AfricaMoldovaMoroccoNepalNetherlandsNicaraguaNigeriaNorth AmericaNorth MacedoniaNorthern AfricaNorthern EuropeNorwayOceaniaPakistanPanamaPeruPhilippinesPolandPortugalRomaniaRussiaSaudi ArabiaScotlandSenegalSerbiaSierra LeoneSingaporeSomaliaSouth AfricaSouth AmericaSouth Central AsiaSouth Eastern AsiaSouthern EuropeSpainSri LankaSt. Vincent and the GrenadinesSudanSwedenSwitzerlandSyriaTaiwanThailandTrinidad and TobagoTurkeyUgandaUkraineUruguayUzbekistanVenezuelaVietnamWest IndiesWestern AfricaWestern AsiaWestern EuropeYemenZaireZimbabweAzores
Ecuadorian
Race
Ancestry
AfghanAfricanAlaska NativeAlaskan AthabascanAlbanianAleutAlsatianAmericanApacheArabArapahoArgentineanArmenianAssyrian/Chaldean/SyriacAustralianAustrianBahamianBangladeshiBarbadianBasqueBelgianBelizeanBermudanBhutaneseBlackfeetBolivianBrazilianBritishBritish West IndianBulgarianBurmeseCajunCambodianCanadianCape VerdeanCarpatho RusynCelticCentral AmericanCentral American IndianCherokeeCheyenneChickasawChileanChineseChippewaChoctawColombianColvilleComancheCosta RicanCreeCreekCroatianCrowCubanCypriotCzechCzechoslovakianDanishDelawareDominicanDutchDutch West IndianEastern EuropeanEcuadorianEgyptianEnglishEstonianEthiopianEuropeanFijianFilipinoFinnishFrenchFrench American IndianFrench CanadianGermanGerman RussianGhanaianGreekGuamanian/ChamorroGuatemalanGuyaneseHaitianHmongHonduranHopiHoumaHungarianIcelanderIndian (Asian)IndonesianInupiatIranianIraqiIrishIroquoisIsraeliItalianJamaicanJapaneseJordanianKenyanKiowaKoreanLaotianLatvianLebaneseLiberianLithuanianLumbeeLuxembourgerMacedonianMalaysianMalteseMarshalleseMenomineeMexicanMexican American IndianMongolianMoroccanNative HawaiianNavajoNepaleseNew ZealanderNicaraguanNigerianNorthern EuropeanNorwegianOkinawanOsageOttawaPaiutePakistaniPalestinianPanamanianParaguayanPennsylvania GermanPeruvianPimaPolishPortuguesePotawatomiPuerto RicanPuget Sound SalishRomanianRussianSalvadoranSamoanScandinavianScotch-IrishScottishSeminoleSenegaleseSerbianShoshoneSierra LeoneanSiouxSlavicSlovakSloveneSomaliSouth AfricanSouth AmericanSouth American IndianSoviet UnionSpaniardSpanishSpanish AmericanSpanish American IndianSri LankanSubsaharan AfricanSudaneseSwedishSwissSyrianTaiwaneseThaiTlingit-HaidaTohono O'OdhamTonganTrinidadian and TobagonianTsimshianTurkishU.S. Virgin IslanderUgandanUkrainianUruguayanUteVenezuelanVietnameseWelshWest IndianYakamaYaquiYugoslavianYumanYup'ikZimbabwean
Immigration
NonimmigrantsImmigrantsAfghanistanAfricaAlbaniaArgentinaArmeniaAsiaAustraliaAustriaBahamasBangladeshBarbadosBelarusBelgiumBelizeBoliviaBosnia and HerzegovinaBrazilBulgariaBurma/MyanmarCabo VerdeCambodiaCameroonCanadaCaribbeanCentral AmericaChileChinaColombiaCongoCosta RicaCroatiaCubaCzechoslovakiaDenmarkDominicaDominican RepublicEastern AfricaEastern AsiaEastern EuropeEcuadorEgyptEl SalvadorEnglandEritreaEthiopiaEuropeFijiFranceGermanyGhanaGreeceGrenadaGuatemalaGuyanaHaitiHondurasHong KongHungaryIndiaIndonesiaIranIraqIrelandIsraelItalyJamaicaJapanJordanKazakhstanKenyaKoreaKuwaitLaosLatin AmericaLatviaLebanonLiberiaLithuaniaMalaysiaMexicoMicronesiaMiddle AfricaMoldovaMoroccoNepalNetherlandsNicaraguaNigeriaNorth AmericaNorth MacedoniaNorthern AfricaNorthern EuropeNorwayOceaniaPakistanPanamaPeruPhilippinesPolandPortugalRomaniaRussiaSaudi ArabiaScotlandSenegalSerbiaSierra LeoneSingaporeSomaliaSouth AfricaSouth AmericaSouth Central AsiaSouth Eastern AsiaSouthern EuropeSpainSri LankaSt. Vincent and the GrenadinesSudanSwedenSwitzerlandSyriaTaiwanThailandTrinidad and TobagoTurkeyUgandaUkraineUruguayUzbekistanVenezuelaVietnamWest IndiesWestern AfricaWestern AsiaWestern EuropeYemenZaireZimbabweAzores
8th Grade
Income
Poverty
Unemployment
Labor Participation
Family Structure
Vehicle Availability
Education Level
Disability

8th Grade Comparison

Pueblo

Ecuadorians

Exceptional
Tragic
96.1%
8TH GRADE
92.3/ 100
METRIC RATING
131st/ 347
METRIC RANK
93.6%
8TH GRADE
0.0/ 100
METRIC RATING
308th/ 347
METRIC RANK

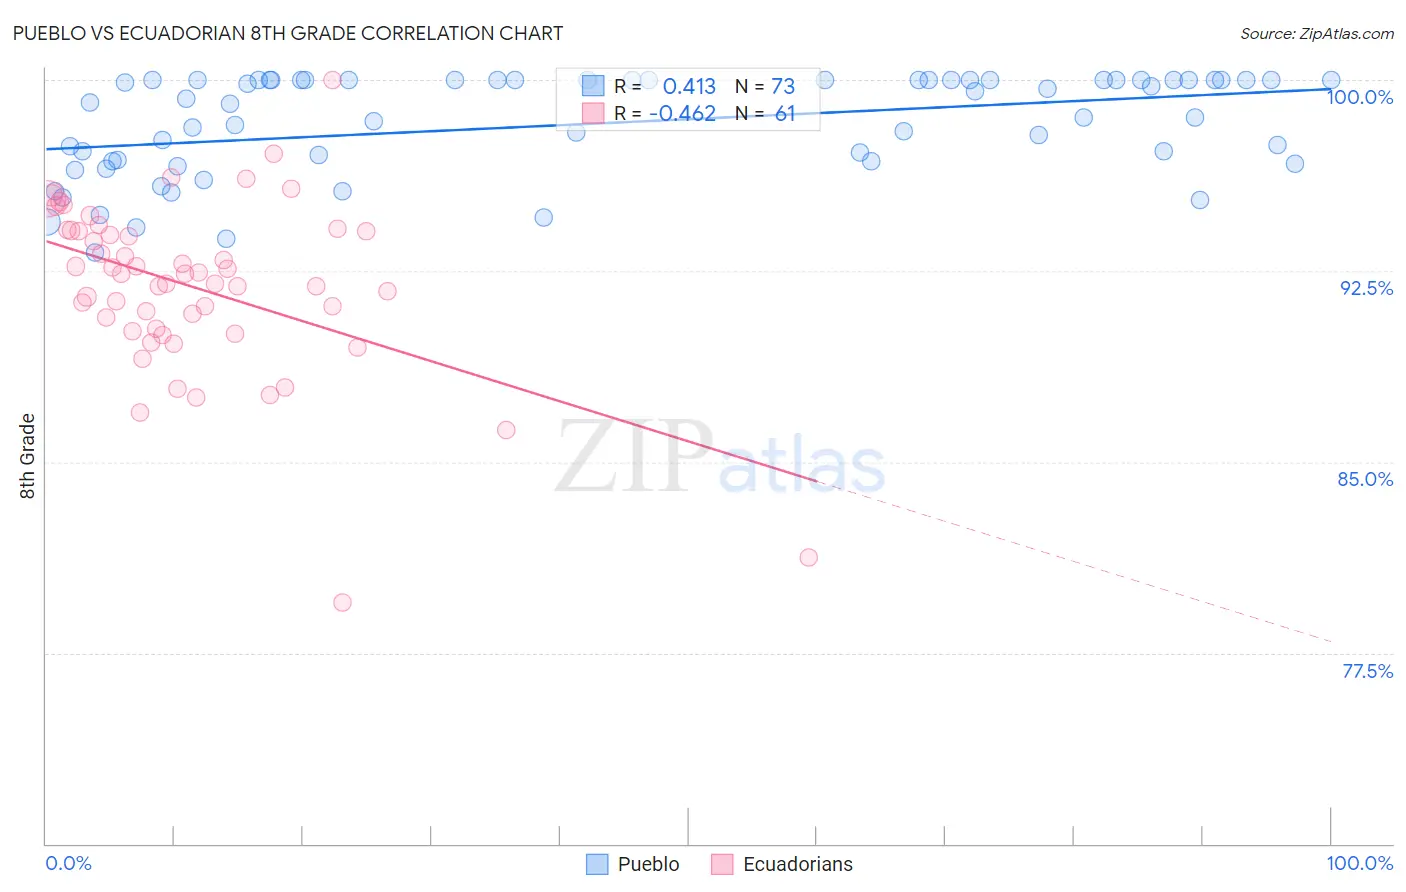
Pueblo vs Ecuadorian 8th Grade Correlation Chart

The statistical analysis conducted on geographies consisting of 120,086,078 people shows a moderate positive correlation between the proportion of Pueblo and percentage of population with at least 8th grade education in the United States with a correlation coefficient (R) of 0.413 and weighted average of 96.1%. Similarly, the statistical analysis conducted on geographies consisting of 317,753,005 people shows a moderate negative correlation between the proportion of Ecuadorians and percentage of population with at least 8th grade education in the United States with a correlation coefficient (R) of -0.462 and weighted average of 93.6%, a difference of 2.7%.
Pueblo vs Ecuadorian 8th Grade

8th Grade Correlation Summary

MeasurementPuebloEcuadorian
Minimum93.2%79.5%
Maximum100.0%100.0%
Range6.8%20.5%
Mean98.3%91.9%
Median99.1%92.4%
Interquartile 25% (IQ1)96.8%90.2%
Interquartile 75% (IQ3)100.0%94.1%
Interquartile Range (IQR)3.2%3.9%
Standard Deviation (Sample)2.0%3.4%
Standard Deviation (Population)2.0%3.4%

Similar Demographics by 8th Grade

Demographics Similar to Pueblo by 8th Grade

In terms of 8th grade, the demographic groups most similar to Pueblo are Immigrants from Kuwait (96.1%, a difference of 0.0%), Soviet Union (96.1%, a difference of 0.010%), Immigrants from Turkey (96.1%, a difference of 0.010%), Cheyenne (96.1%, a difference of 0.020%), and Immigrants from Hungary (96.1%, a difference of 0.020%).
DemographicsRating | Rank8th Grade
Palestinians
94.6
/100
|
#124
Exceptional
96.2%
Immigrants | Romania
94.1
/100
|
#125
Exceptional
96.2%
Choctaw
94.0
/100
|
#126
Exceptional
96.2%
Immigrants | Serbia
94.0
/100
|
#127
Exceptional
96.2%
Immigrants | Bosnia and Herzegovina
93.9
/100
|
#128
Exceptional
96.2%
Cheyenne
93.3
/100
|
#129
Exceptional
96.1%
Soviet Union
92.6
/100
|
#130
Exceptional
96.1%
Pueblo
92.3
/100
|
#131
Exceptional
96.1%
Immigrants | Kuwait
92.2
/100
|
#132
Exceptional
96.1%
Immigrants | Turkey
91.7
/100
|
#133
Exceptional
96.1%
Immigrants | Hungary
91.5
/100
|
#134
Exceptional
96.1%
Basques
91.5
/100
|
#135
Exceptional
96.1%
Jordanians
91.3
/100
|
#136
Exceptional
96.1%
Cambodians
90.6
/100
|
#137
Exceptional
96.1%
Burmese
90.2
/100
|
#138
Exceptional
96.1%

Demographics Similar to Ecuadorians by 8th Grade

In terms of 8th grade, the demographic groups most similar to Ecuadorians are Immigrants (93.6%, a difference of 0.020%), Japanese (93.6%, a difference of 0.030%), Immigrants from Bangladesh (93.6%, a difference of 0.030%), Cape Verdean (93.5%, a difference of 0.070%), and Immigrants from Caribbean (93.5%, a difference of 0.10%).
DemographicsRating | Rank8th Grade
Immigrants | Laos
0.0
/100
|
#301
Tragic
94.1%
Sri Lankans
0.0
/100
|
#302
Tragic
94.0%
Immigrants | Dominica
0.0
/100
|
#303
Tragic
94.0%
Guyanese
0.0
/100
|
#304
Tragic
93.9%
Immigrants | Haiti
0.0
/100
|
#305
Tragic
93.9%
Immigrants | Guyana
0.0
/100
|
#306
Tragic
93.8%
Immigrants | Portugal
0.0
/100
|
#307
Tragic
93.8%
Ecuadorians
0.0
/100
|
#308
Tragic
93.6%
Immigrants | Immigrants
0.0
/100
|
#309
Tragic
93.6%
Japanese
0.0
/100
|
#310
Tragic
93.6%
Immigrants | Bangladesh
0.0
/100
|
#311
Tragic
93.6%
Cape Verdeans
0.0
/100
|
#312
Tragic
93.5%
Immigrants | Caribbean
0.0
/100
|
#313
Tragic
93.5%
Immigrants | Vietnam
0.0
/100
|
#314
Tragic
93.5%
Vietnamese
0.0
/100
|
#315
Tragic
93.5%