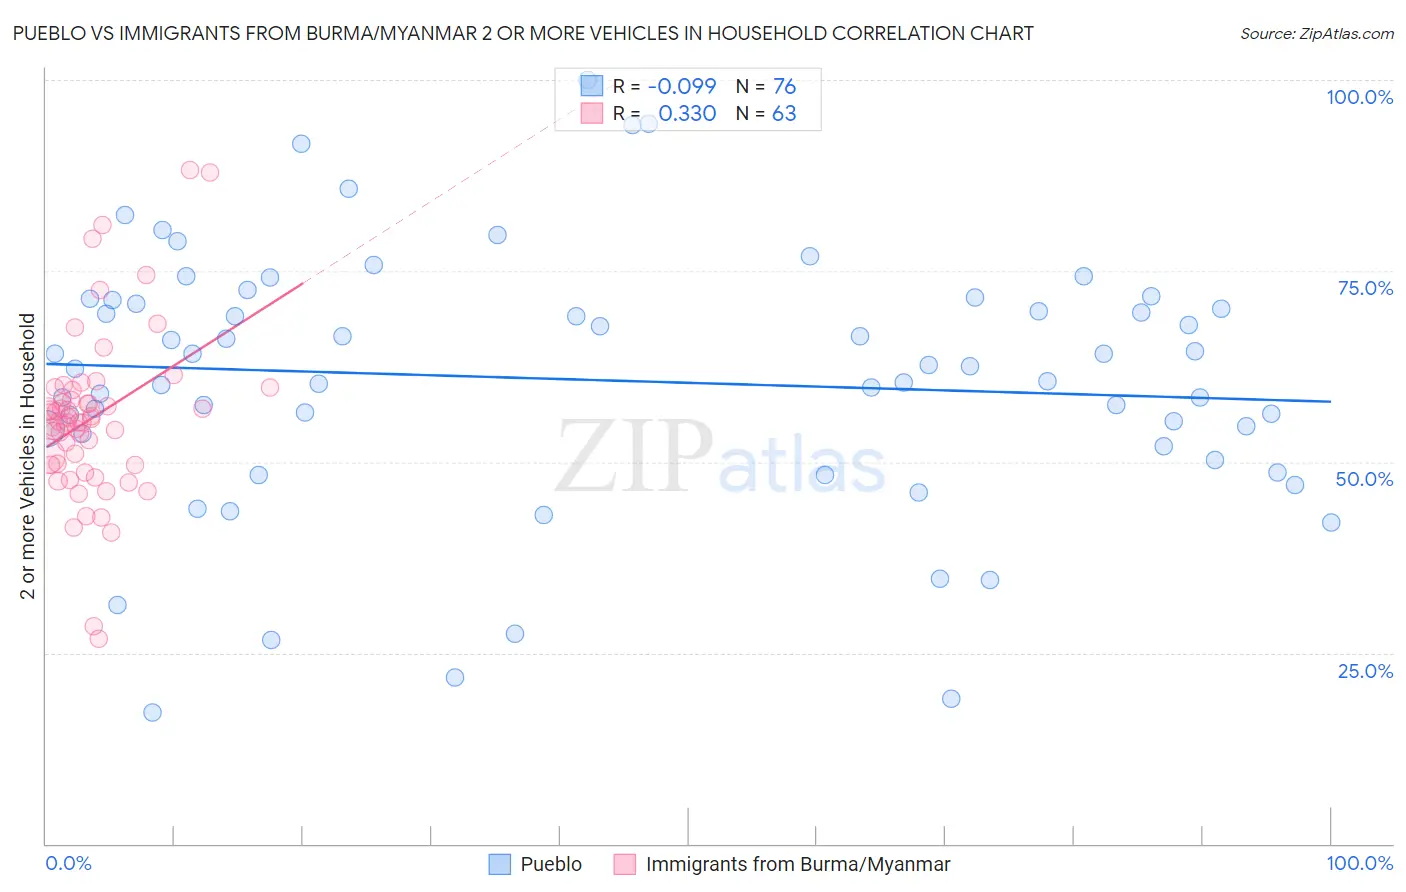
Pueblo vs Immigrants from Burma/Myanmar 2 or more Vehicles in Household
COMPARE
Pueblo
Immigrants from Burma/Myanmar
2 or more Vehicles in Household
2 or more Vehicles in Household Comparison
Pueblo
Immigrants from Burma/Myanmar
57.5%
2 OR MORE VEHICLES IN HOUSEHOLD
98.0/ 100
METRIC RATING
112th/ 347
METRIC RANK
53.9%
2 OR MORE VEHICLES IN HOUSEHOLD
7.1/ 100
METRIC RATING
217th/ 347
METRIC RANK
Pueblo vs Immigrants from Burma/Myanmar 2 or more Vehicles in Household Correlation Chart
The statistical analysis conducted on geographies consisting of 120,072,908 people shows a slight negative correlation between the proportion of Pueblo and percentage of households with 2 or more vehicles available in the United States with a correlation coefficient (R) of -0.099 and weighted average of 57.5%. Similarly, the statistical analysis conducted on geographies consisting of 172,281,201 people shows a mild positive correlation between the proportion of Immigrants from Burma/Myanmar and percentage of households with 2 or more vehicles available in the United States with a correlation coefficient (R) of 0.330 and weighted average of 53.9%, a difference of 6.6%.
2 or more Vehicles in Household Correlation Summary
| Measurement | Pueblo | Immigrants from Burma/Myanmar |
| Minimum | 17.1% | 26.8% |
| Maximum | 100.0% | 88.2% |
| Range | 82.9% | 61.4% |
| Mean | 60.7% | 55.8% |
| Median | 62.3% | 55.3% |
| Interquartile 25% (IQ1) | 52.9% | 49.6% |
| Interquartile 75% (IQ3) | 70.9% | 59.4% |
| Interquartile Range (IQR) | 18.0% | 9.8% |
| Standard Deviation (Sample) | 17.0% | 11.1% |
| Standard Deviation (Population) | 16.9% | 11.0% |
Similar Demographics by 2 or more Vehicles in Household
Demographics Similar to Pueblo by 2 or more Vehicles in Household
In terms of 2 or more vehicles in household, the demographic groups most similar to Pueblo are Greek (57.5%, a difference of 0.0%), Japanese (57.5%, a difference of 0.040%), Immigrants from North America (57.5%, a difference of 0.050%), Immigrants from Canada (57.5%, a difference of 0.090%), and Immigrants from Netherlands (57.5%, a difference of 0.10%).
| Demographics | Rating | Rank | 2 or more Vehicles in Household |
| Immigrants | Korea | 98.2 /100 | #105 | Exceptional 57.6% |
| Immigrants | Oceania | 98.2 /100 | #106 | Exceptional 57.5% |
| Immigrants | Netherlands | 98.2 /100 | #107 | Exceptional 57.5% |
| Immigrants | Canada | 98.1 /100 | #108 | Exceptional 57.5% |
| Immigrants | North America | 98.1 /100 | #109 | Exceptional 57.5% |
| Japanese | 98.0 /100 | #110 | Exceptional 57.5% |
| Greeks | 98.0 /100 | #111 | Exceptional 57.5% |
| Pueblo | 98.0 /100 | #112 | Exceptional 57.5% |
| Zimbabweans | 96.9 /100 | #113 | Exceptional 57.2% |
| Immigrants | Lebanon | 96.8 /100 | #114 | Exceptional 57.2% |
| Chippewa | 96.6 /100 | #115 | Exceptional 57.2% |
| Immigrants | Jordan | 96.6 /100 | #116 | Exceptional 57.2% |
| Iraqis | 95.8 /100 | #117 | Exceptional 57.1% |
| Asians | 95.1 /100 | #118 | Exceptional 57.0% |
| Natives/Alaskans | 95.0 /100 | #119 | Exceptional 57.0% |
Demographics Similar to Immigrants from Burma/Myanmar by 2 or more Vehicles in Household
In terms of 2 or more vehicles in household, the demographic groups most similar to Immigrants from Burma/Myanmar are Immigrants from Argentina (53.9%, a difference of 0.050%), South American Indian (53.9%, a difference of 0.11%), Taiwanese (53.9%, a difference of 0.13%), Immigrants from Singapore (53.9%, a difference of 0.14%), and Kiowa (53.9%, a difference of 0.16%).
| Demographics | Rating | Rank | 2 or more Vehicles in Household |
| Immigrants | Saudi Arabia | 11.3 /100 | #210 | Poor 54.2% |
| Immigrants | Hungary | 11.3 /100 | #211 | Poor 54.2% |
| Immigrants | Chile | 11.1 /100 | #212 | Poor 54.2% |
| Guatemalans | 9.6 /100 | #213 | Tragic 54.1% |
| Immigrants | Czechoslovakia | 9.4 /100 | #214 | Tragic 54.1% |
| Aleuts | 9.3 /100 | #215 | Tragic 54.1% |
| Immigrants | Western Asia | 9.3 /100 | #216 | Tragic 54.1% |
| Immigrants | Burma/Myanmar | 7.1 /100 | #217 | Tragic 53.9% |
| Immigrants | Argentina | 6.8 /100 | #218 | Tragic 53.9% |
| South American Indians | 6.5 /100 | #219 | Tragic 53.9% |
| Taiwanese | 6.3 /100 | #220 | Tragic 53.9% |
| Immigrants | Singapore | 6.3 /100 | #221 | Tragic 53.9% |
| Kiowa | 6.2 /100 | #222 | Tragic 53.9% |
| Immigrants | Bosnia and Herzegovina | 5.5 /100 | #223 | Tragic 53.8% |
| Brazilians | 5.3 /100 | #224 | Tragic 53.8% |