Polish vs Central American 4 or more Vehicles in Household
COMPARE
Polish
Central American
4 or more Vehicles in Household
4 or more Vehicles in Household Comparison
Poles
Central Americans
6.4%
4 OR MORE VEHICLES IN HOUSEHOLD
56.9/ 100
METRIC RATING
167th/ 347
METRIC RANK
7.1%
4 OR MORE VEHICLES IN HOUSEHOLD
99.3/ 100
METRIC RATING
96th/ 347
METRIC RANK
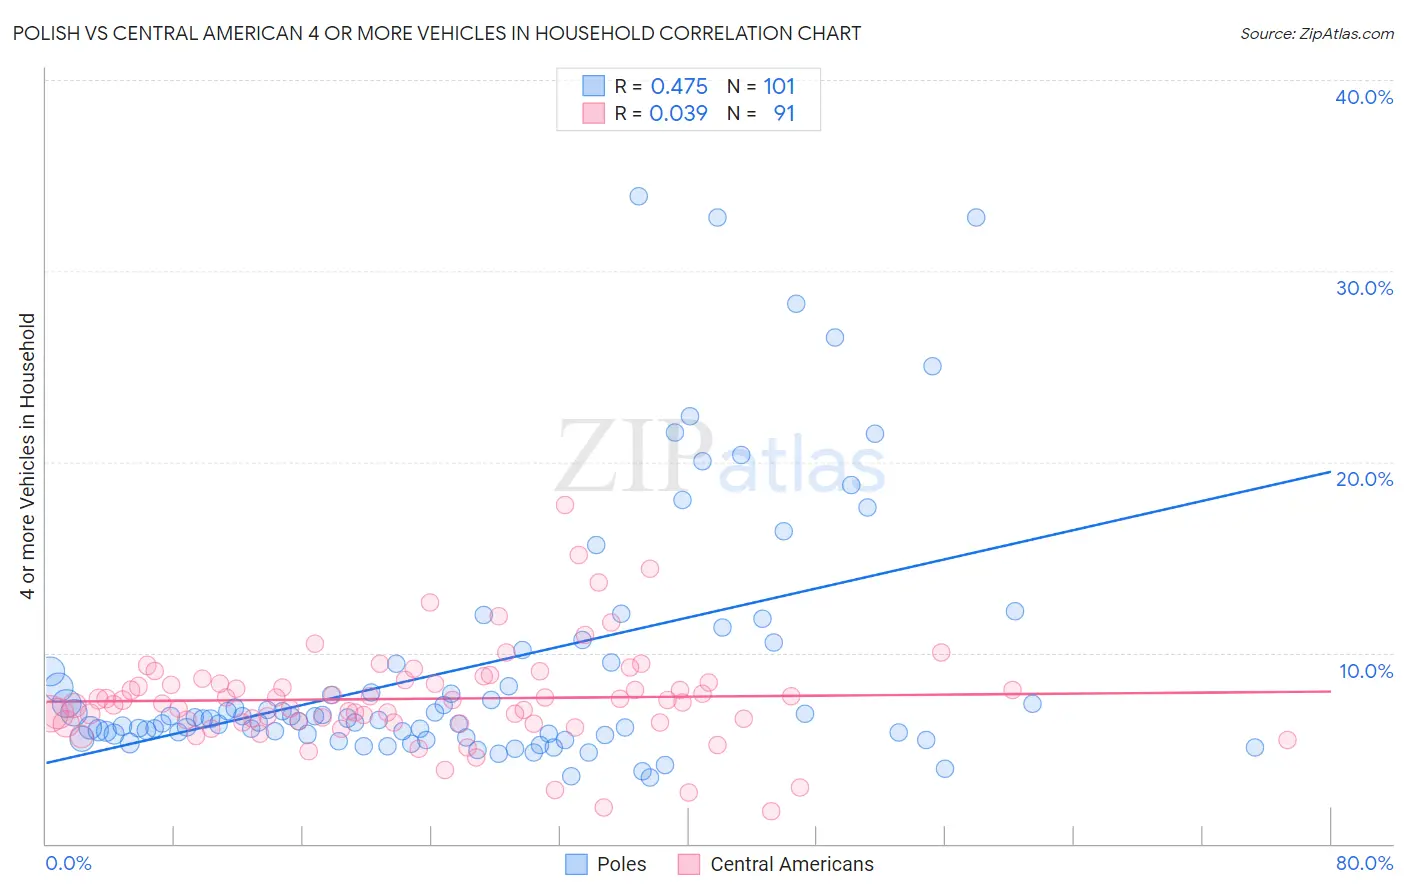
Polish vs Central American 4 or more Vehicles in Household Correlation Chart
The statistical analysis conducted on geographies consisting of 557,050,036 people shows a moderate positive correlation between the proportion of Poles and percentage of households with 4 or more vehicles available in the United States with a correlation coefficient (R) of 0.475 and weighted average of 6.4%. Similarly, the statistical analysis conducted on geographies consisting of 501,959,765 people shows no correlation between the proportion of Central Americans and percentage of households with 4 or more vehicles available in the United States with a correlation coefficient (R) of 0.039 and weighted average of 7.1%, a difference of 11.7%.
4 or more Vehicles in Household Correlation Summary
| Measurement | Polish | Central American |
| Minimum | 3.5% | 1.7% |
| Maximum | 33.9% | 17.7% |
| Range | 30.4% | 16.0% |
| Mean | 9.3% | 7.6% |
| Median | 6.6% | 7.5% |
| Interquartile 25% (IQ1) | 5.7% | 6.3% |
| Interquartile 75% (IQ3) | 9.5% | 8.4% |
| Interquartile Range (IQR) | 3.7% | 2.1% |
| Standard Deviation (Sample) | 6.7% | 2.6% |
| Standard Deviation (Population) | 6.7% | 2.6% |
Similar Demographics by 4 or more Vehicles in Household
Demographics Similar to Poles by 4 or more Vehicles in Household
In terms of 4 or more vehicles in household, the demographic groups most similar to Poles are Immigrants from Denmark (6.4%, a difference of 0.10%), Lebanese (6.4%, a difference of 0.11%), Estonian (6.4%, a difference of 0.18%), Immigrants from Peru (6.4%, a difference of 0.31%), and Immigrants from Syria (6.3%, a difference of 0.42%).
| Demographics | Rating | Rank | 4 or more Vehicles in Household |
| Palestinians | 65.8 /100 | #160 | Good 6.4% |
| Immigrants | Cameroon | 64.4 /100 | #161 | Good 6.4% |
| Immigrants | Pakistan | 63.2 /100 | #162 | Good 6.4% |
| Chileans | 61.2 /100 | #163 | Good 6.4% |
| Hungarians | 61.1 /100 | #164 | Good 6.4% |
| Immigrants | Peru | 59.8 /100 | #165 | Average 6.4% |
| Immigrants | Denmark | 57.8 /100 | #166 | Average 6.4% |
| Poles | 56.9 /100 | #167 | Average 6.4% |
| Lebanese | 55.8 /100 | #168 | Average 6.4% |
| Estonians | 55.1 /100 | #169 | Average 6.4% |
| Immigrants | Syria | 52.8 /100 | #170 | Average 6.3% |
| Immigrants | India | 51.9 /100 | #171 | Average 6.3% |
| Immigrants | Lebanon | 51.7 /100 | #172 | Average 6.3% |
| Slovenes | 51.1 /100 | #173 | Average 6.3% |
| Lithuanians | 50.0 /100 | #174 | Average 6.3% |
Demographics Similar to Central Americans by 4 or more Vehicles in Household
In terms of 4 or more vehicles in household, the demographic groups most similar to Central Americans are Czechoslovakian (7.1%, a difference of 0.010%), Immigrants from Afghanistan (7.1%, a difference of 0.23%), Dutch West Indian (7.1%, a difference of 0.23%), Celtic (7.1%, a difference of 0.35%), and Immigrants from Latin America (7.1%, a difference of 0.41%).
| Demographics | Rating | Rank | 4 or more Vehicles in Household |
| British | 99.6 /100 | #89 | Exceptional 7.2% |
| Creek | 99.6 /100 | #90 | Exceptional 7.2% |
| Assyrians/Chaldeans/Syriacs | 99.4 /100 | #91 | Exceptional 7.2% |
| Immigrants | Latin America | 99.4 /100 | #92 | Exceptional 7.1% |
| Immigrants | Afghanistan | 99.3 /100 | #93 | Exceptional 7.1% |
| Dutch West Indians | 99.3 /100 | #94 | Exceptional 7.1% |
| Czechoslovakians | 99.3 /100 | #95 | Exceptional 7.1% |
| Central Americans | 99.3 /100 | #96 | Exceptional 7.1% |
| Celtics | 99.1 /100 | #97 | Exceptional 7.1% |
| Irish | 99.0 /100 | #98 | Exceptional 7.1% |
| Seminole | 98.8 /100 | #99 | Exceptional 7.0% |
| Taiwanese | 98.7 /100 | #100 | Exceptional 7.0% |
| Pakistanis | 98.7 /100 | #101 | Exceptional 7.0% |
| Asians | 98.6 /100 | #102 | Exceptional 7.0% |
| Blackfeet | 98.6 /100 | #103 | Exceptional 7.0% |